Intro
Following Tomas’ advise, we are publishing a conversation between Sasha Englemann and myself, regarding how to record a trajectory with a cheap Garmin e-Trex 10 GPS and then convert it into a beautiful 3D visualization in Google Earth.
On Wed, Sep 13, 2017 at 10:00 AM, Tomas Saraceno wrote:
Cool
Joaquin was suggesting using a garmin x make aerogliphyc drawings as alternative
It track a position every second .
Should we buy one and give it to Sasha
I really like idea drawings in the air
Then Sasha and studen can share theirs :
Daniel let’s buy borrow a garmin
We have one ?
El 13 sep. 2017, a las 06:36, Daniel Schulz escribió:
Hi Everybody,
yes we have two garmin´s etrex10.
One Thomas Krahn still has from the last free flight.
The other one I could not find.
I will take care to organize it and give it as soon as possible to Sasha.
So the bag pack AE 017 has just left the studio with Sasha Engelmann ![]()
On Wed, Sep 13, 2017 at 1:29 PM, Joaquin Ezcurra wrote:
Hi there! Regarding tracking the flight with a Garmin e-Trex 10.
First set the GPS record track interval to 1 second (lowest possible).
See this video from minute 1 onwards for very detailed instructions on how to do it:

Aerocene’s custom tracker records at 2 seconds interval, so Garmin eTrex should deliver more accurate results.
After flight, download Garmin Basecamp:
Download data from flight to Basecamp and Export as KML 2.2.
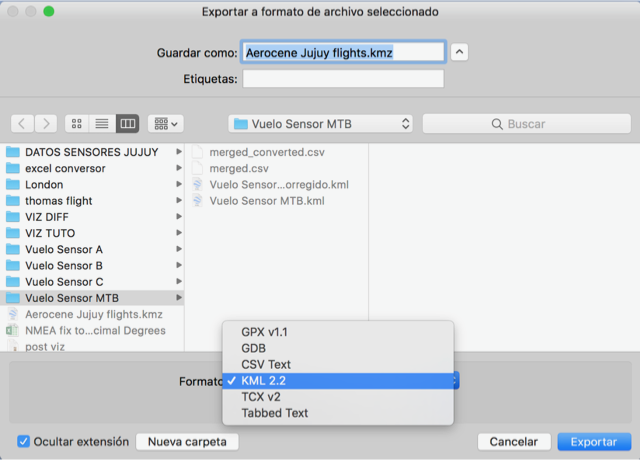
Open KML file on Google Earth and enjoy flight visualization.
Let me know if you need any help with this!
Happy flights! ![]()
Joaquin
El 29 oct. 2017, a las 07:49, Sasha Engelmann escribió:
Hi Joaquin,
Thanks for checking up on this! Bronislaw Szerszynski and I are planning to do a tethered launch of the Aerocene Explorer this week, up in Lancaster. So far the weather looks pretty good on Thursday, so we are hoping we can test the Garmin flight tracker to register the flight data, and of course we will send it to you as soon as we can. One of my goals for today and tomorrow is to read the information you sent earlier about how to use the Garmin and how to download / process the data.
I was also in touch with Ignas last week about announcing the Lancaster Aerocene launch on the Aerocene website. What do you think? Or would it be better for us to send you the pictures and data after the launch, and then you could upload it to the Aerocene website? Just let me know.
For some context, the Aerocene launch I am referring to will happen in a “Mobile Utopia Experiment” called “The Drift Economy” that Bron and I are running together this week. We are also hosting a conference session called “Atmospheric Adventures in the Aerocene: Heterotopias of Aerial Mobility” on Friday afternoon. Sam Hertz (who has written for Aerocene publications in the past) will be speaking, as well as myself, Bron and Rob La Frenais, who Tomás knows quite well. The conference session will happen on Friday afternoon, hopefully after we have launched the Aerocene sculpture and collected some data for you. So, yes, it will be a week of drifting, launching and thinking about Aerocene.
More soon…
Best wishes,
Sasha
2017-10-29 19:16 GMT+00:00 Joaquin Ezcurra:
Hi Sasha!
Plans for the tethered flight in Lancaster sound brilliant! For the flight all you really have to do is:
Hi there! Regarding tracking the flight with a Garmin e-Trex 10.
First set the GPS record track interval to 1 second (lowest possible).
See this video from minute 1 onwards for very detailed instructions on how to do it:
Aerocene’s custom tracker records at 2 seconds interval, so Garmin eTrex should deliver more accurate results.
And make sure the GPS batteries are in good shape, you might as well buy two AA batteries just in case.
I think it would be better to publish the flight once you have all the info. Text, pictures, and trajectory visualization as well ![]()
Ignas can help you with the Aerocene website entry, but if you need my help I am at your service too.
I wish you guys all the best for the coming week,
Joaquín
El 31 oct. 2017, a las 16:38, Sasha Engelmann escribió:
Hey Joaquin,
I was just testing the Garmin flight tracker around my house. I have a few questions.
First, I watched the videos you sent. I set up the “Track Record” as explained in the video, and set the time interval to 1 second. The video goes on to explain how to set the interval based on distance, but I am pretty sure that the interval should be based only on time (1 second), right?
Second, I made a test ‘track’ around my house, and followed the data on the map visualization on the Garmin device. However, when I tried to save the track in order to download it onto my computer to test out BaseCamp, I received a message that said that “memory is full” and that I need to delete waypoints, routes and other things that are saved in the Garmin tracker before I can ‘save a new track’. I was wondering whether it is OK for me to delete / clear the waypoints and routes that are saved? I wasn’t sure if you guys perhaps needed the data.
Third, I understand that once the track record is set, and the interval is 1second, Garmin will start recording the ‘track’ as along as it is turned on. How far in advance of the Aerocene launch should I turn on the Garmin? For example should I turn it on once the sculpture is inflated, or only once it is about to take off?
The batteries in the Garmin seem to be full, but I have purchased another set of double AAs and will exchange them before the flight.
Lastly, it looks like it will be sunny on Thursday in Lancaster. This is really amazing! We have had almost nothing except gray clouds here in the UK, and a recent Storm Ophelia which caused a lot of damage in the North. So the fact that the weather forecast is so far good is really great news! Although it might be a bit windy…
Ok, let me know if you have the answers to these questions when you get a moment.
Best,
Sasha
2017-10-31 21:29 GMT+00:00 Joaquin Ezcurra:
Hi Sasha! Fantastic!
Interval should be set to the time dimension, not distance, that’s right.
Regarding data saved on the GPS, I can assume that it would be safe to delete, but since it’s not my GPS, maybe you should ask.
I have copied Camilla who can maybe ask around the studio if it’s ok to delete data on a GPS Sasha borrowed?
Sasha also you might try to download current data from GPS, then save as GPX file format on computer, then safely delete from GPS…
Surely, you need to have a clean slate on the GPS since 1 waypoint per second is going to create 3600 points in one hour.
According to what I read, the eTrex 10 can store up to 10000 points, that is roughly 3 hours worth of high definition tracking.
Taking this into account, only turn on tracking slightly before flight! Most importantly, I would say of utmost importance:
check etrex gps time, and write it down slightly before flight begins, and slightly before flight ends.
This way we will be able to isolate the flight trajectory more precisely. Same procedure for each flight.
Also it would be cool to keep a log of observed weather: cloudy? sunny? apparent wind speed?
It might be worth checking the Windy.com site for Lancaster, that uses the most technologically advanced model for weather prediction.
Windy: Wind map & weather forecast
Looking good indeed for sunday morning! wind at 4 to 3 knots shouldn’t be an issue, but do keep an eye open if there is increasing wind.
From the visualization point of view, it might be interesting to have a few short flights, instead of a long one.
Maybe moving around a wee bit. Good luck! Above all > Have fun!!!
Joaquin
Hi Joaquin,
I downloaded the data (in GPX) format, from the Garmin. I could see that the last waypoints were in Buenos Aires and the mountains of Bolivia - I remember that trip! ![]()

Now I will clear space for the new tracks in the Garmin device. I still have some time tomorrow to work on this if I need to (we plan to make the first flight attempt on Thursday).
Best wishes,
S
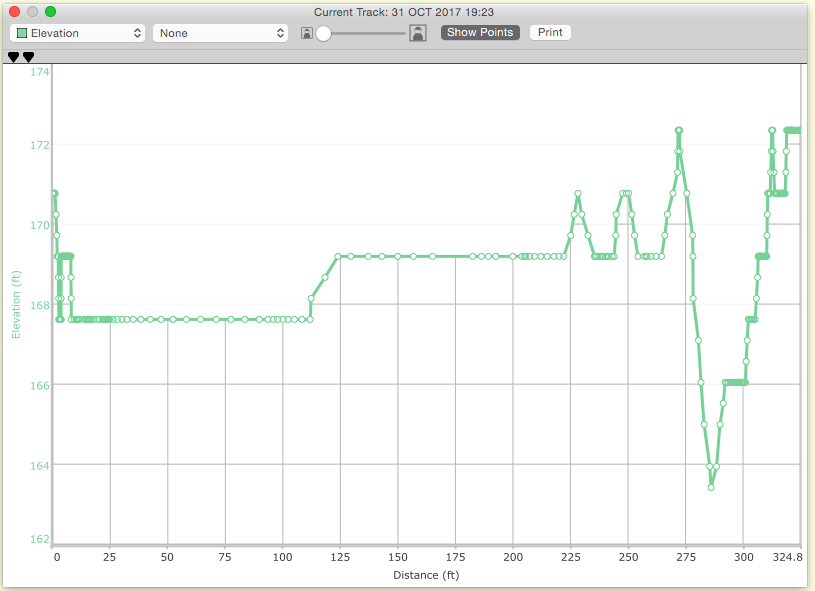
PS: As a test, I tried to find a way to see the data from the ‘test’ Track I did in my house. I found two mechanisms of looking at the data in terms of elevation and in terms of speed. See below.
I just want to check that this is indeed the kind of data you are looking for? It’s not as pretty as the ones that I have seen made at the Studio- but I expect that you have some way of combining and visualizing the data from Garmin / BaseCamp which makes the very beautiful multicolored aero-grams?

El 2 nov. 2017, a las 13:48, Sasha Engelmann escribió:
Hi Joaquin,
Thanks again for all your help!
Okay - I downloaded the data from today’s Aerocene flight, and exported it in KML 2.2 format from Basecamp. I opened it in Google Earth. Now I am seeing the path of the sculpture plotted in a bright turquoise line.
Here is a screenshot looking down at Earth’s surface
I can zoom in on it close to the ground:
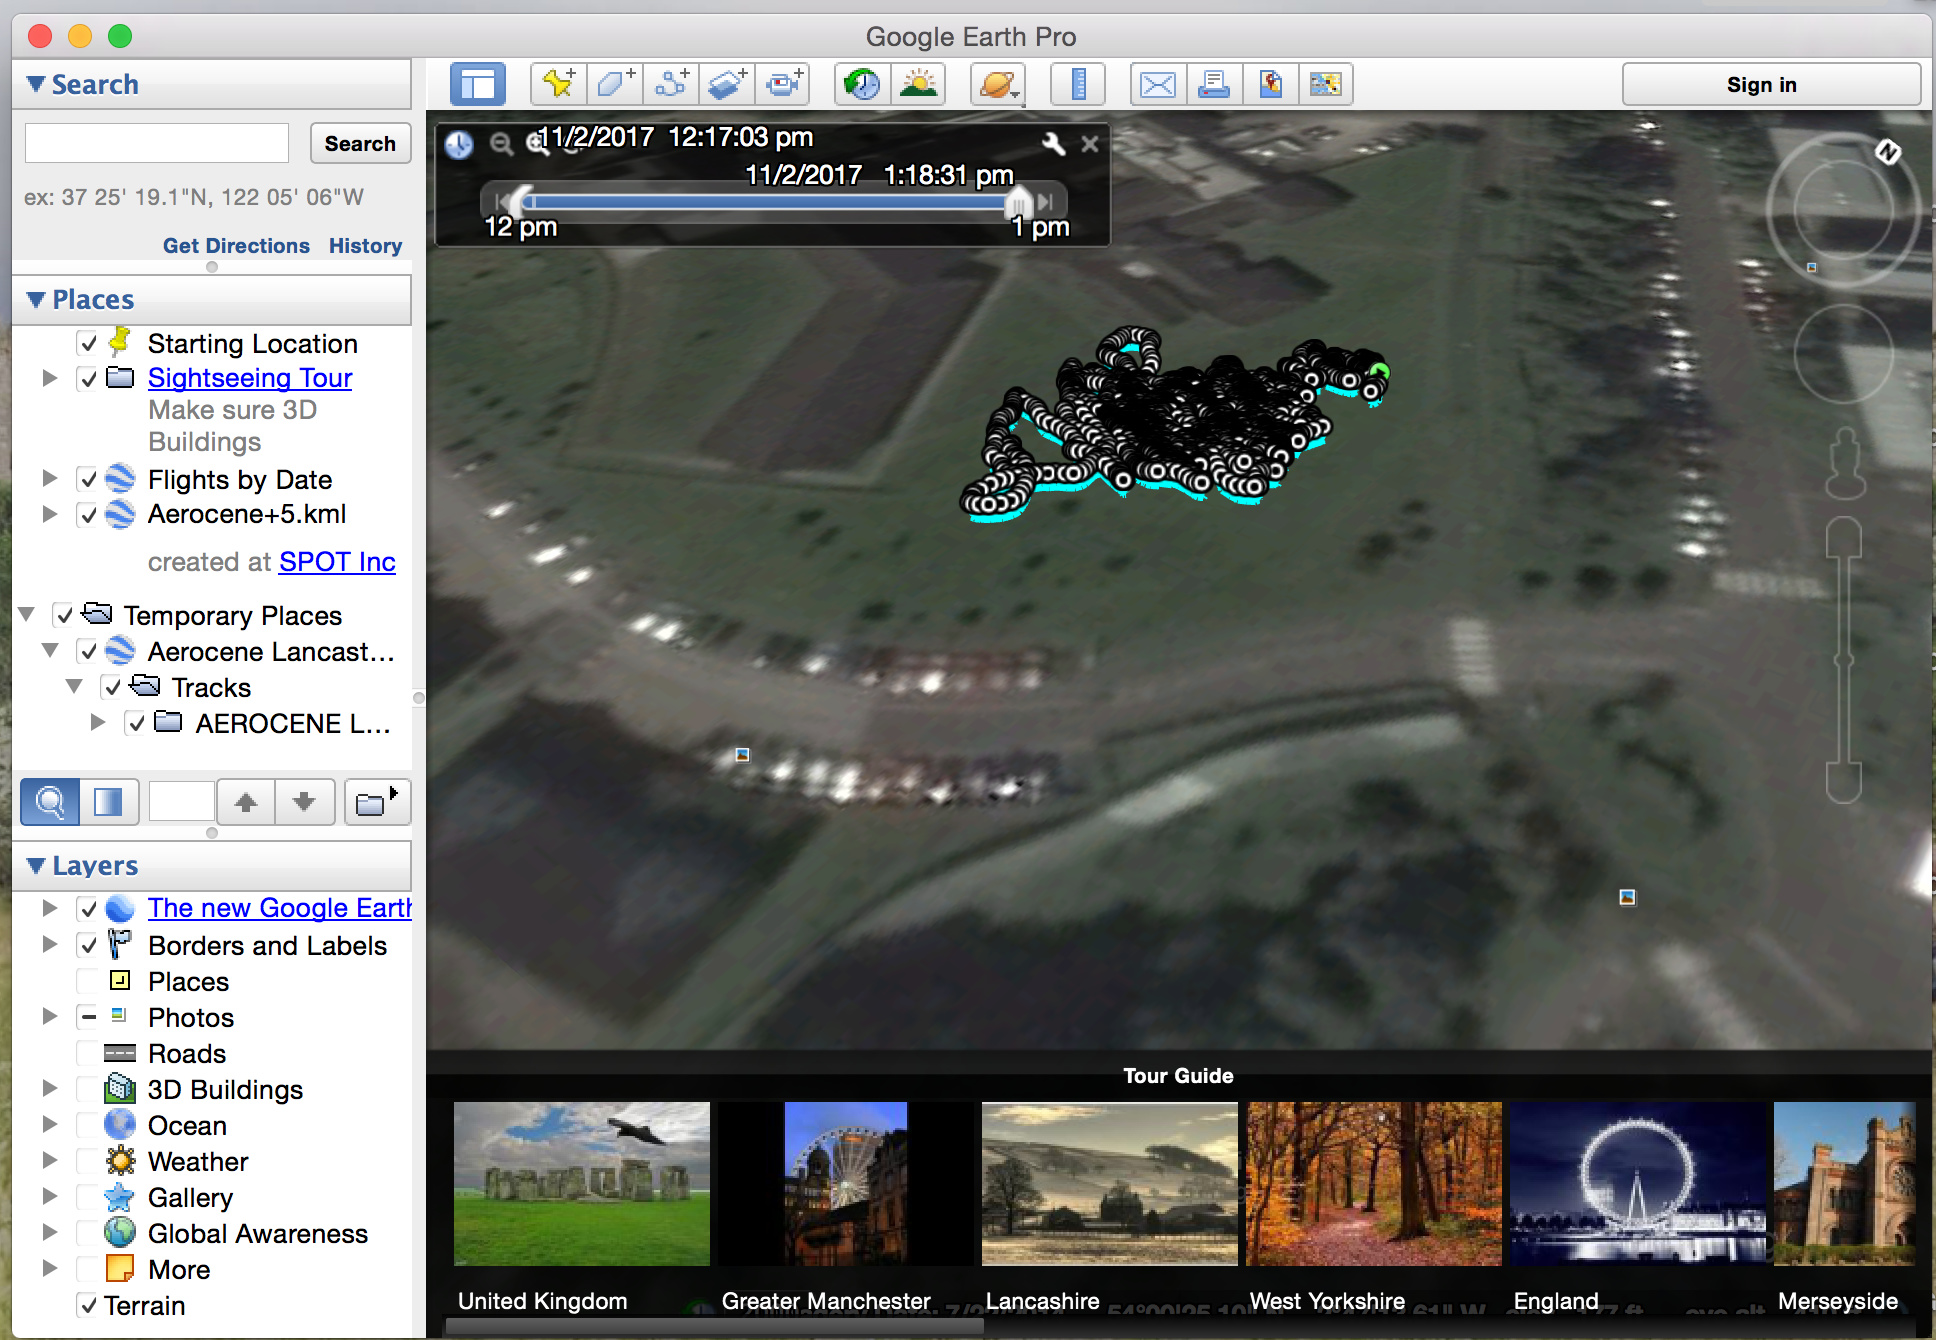
Now, this all looks cool but it is relatively ‘flat’ to earth’s surface - it doesn’t show any elevation, which is the most exciting part!
Do you know how I would go and ‘unflatten’ the data?
Do you have any other tips for this visualization?
Thanks again!!!
Sasha
On Thu 2. Nov 2017 at 18:34, Joaquin Ezcurra wrote:
Hi Sasha! Excelent news.
There’s some tweaking left to do on Google Earth, but you are almost there.
In order to unflatten the trajectoty try this:
1- Open the folders on the left hand side of Google Earths interface until you see a 3 dots icon like this:

2- Right click on it and select the last option from the contextual menu which should be “Get information” in english

3- On this new window cycle to the fourth tab that should be Altitude in english:
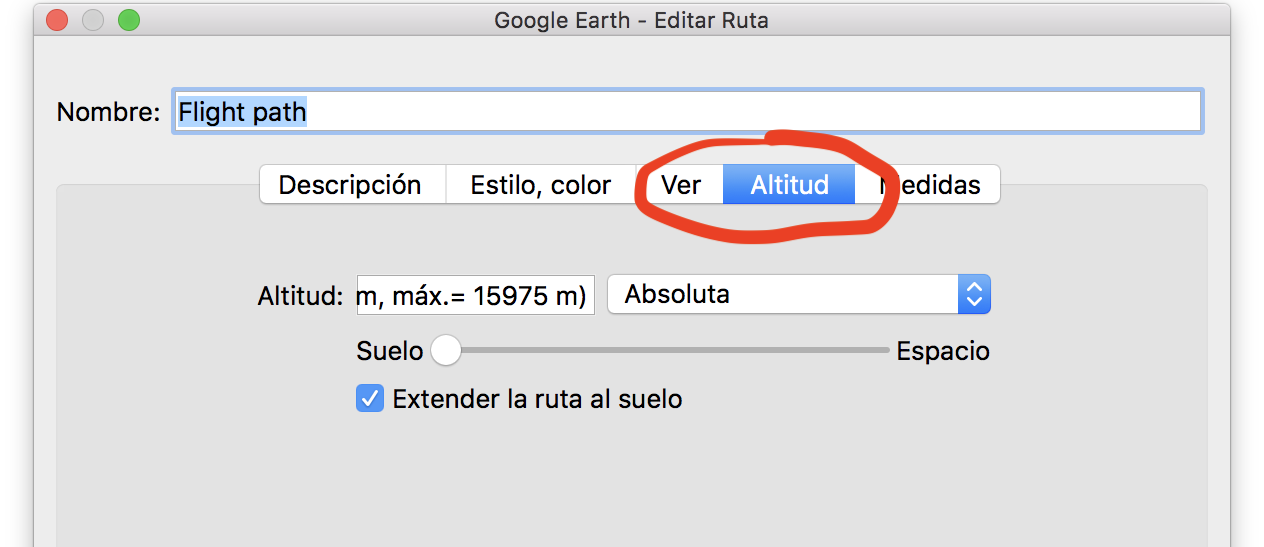
Make sure its set to absolute (like example above) and that the extend to ground option is unticked, unlike the example above.
4- Then on the window’s second tab, Style & color, you can play with the trajectory line’s color, thickness and opacity.

5- Finally click on the OK button on the window’s bottom right corner.
If you wish, we can arrange to do a Skype on which I share my screen and share another pro-tips on how to make it look nicer!
Congratulations!!!
Joaquín
2017-11-03 5:43 GMT+00:00 Tomas Saraceno:
Amazing :):))))
Joaquin can we upload this instruction in web page ?
Will be super cool have this tutorial :)))
What do you think ?
Cool Sascha saw some pictures amazing!!!
El 3 nov. 2017, a las 07:06, Sasha Engelmann escribió:
Thanks Tomás ![]()
Joaquin - I agree with Tomás about uploading your instructions somewhere online. I actually find your step by step notes to be really clear and easy to follow. I am not so sophisticated with computer or software you are excellent at communicating what needs to be done- I just followed your earlier instructions about Google Earth and it only took me a few minutes!
Also - please let me know if I am taking too much of your time with my constant questions! I understand you are probably really busy.
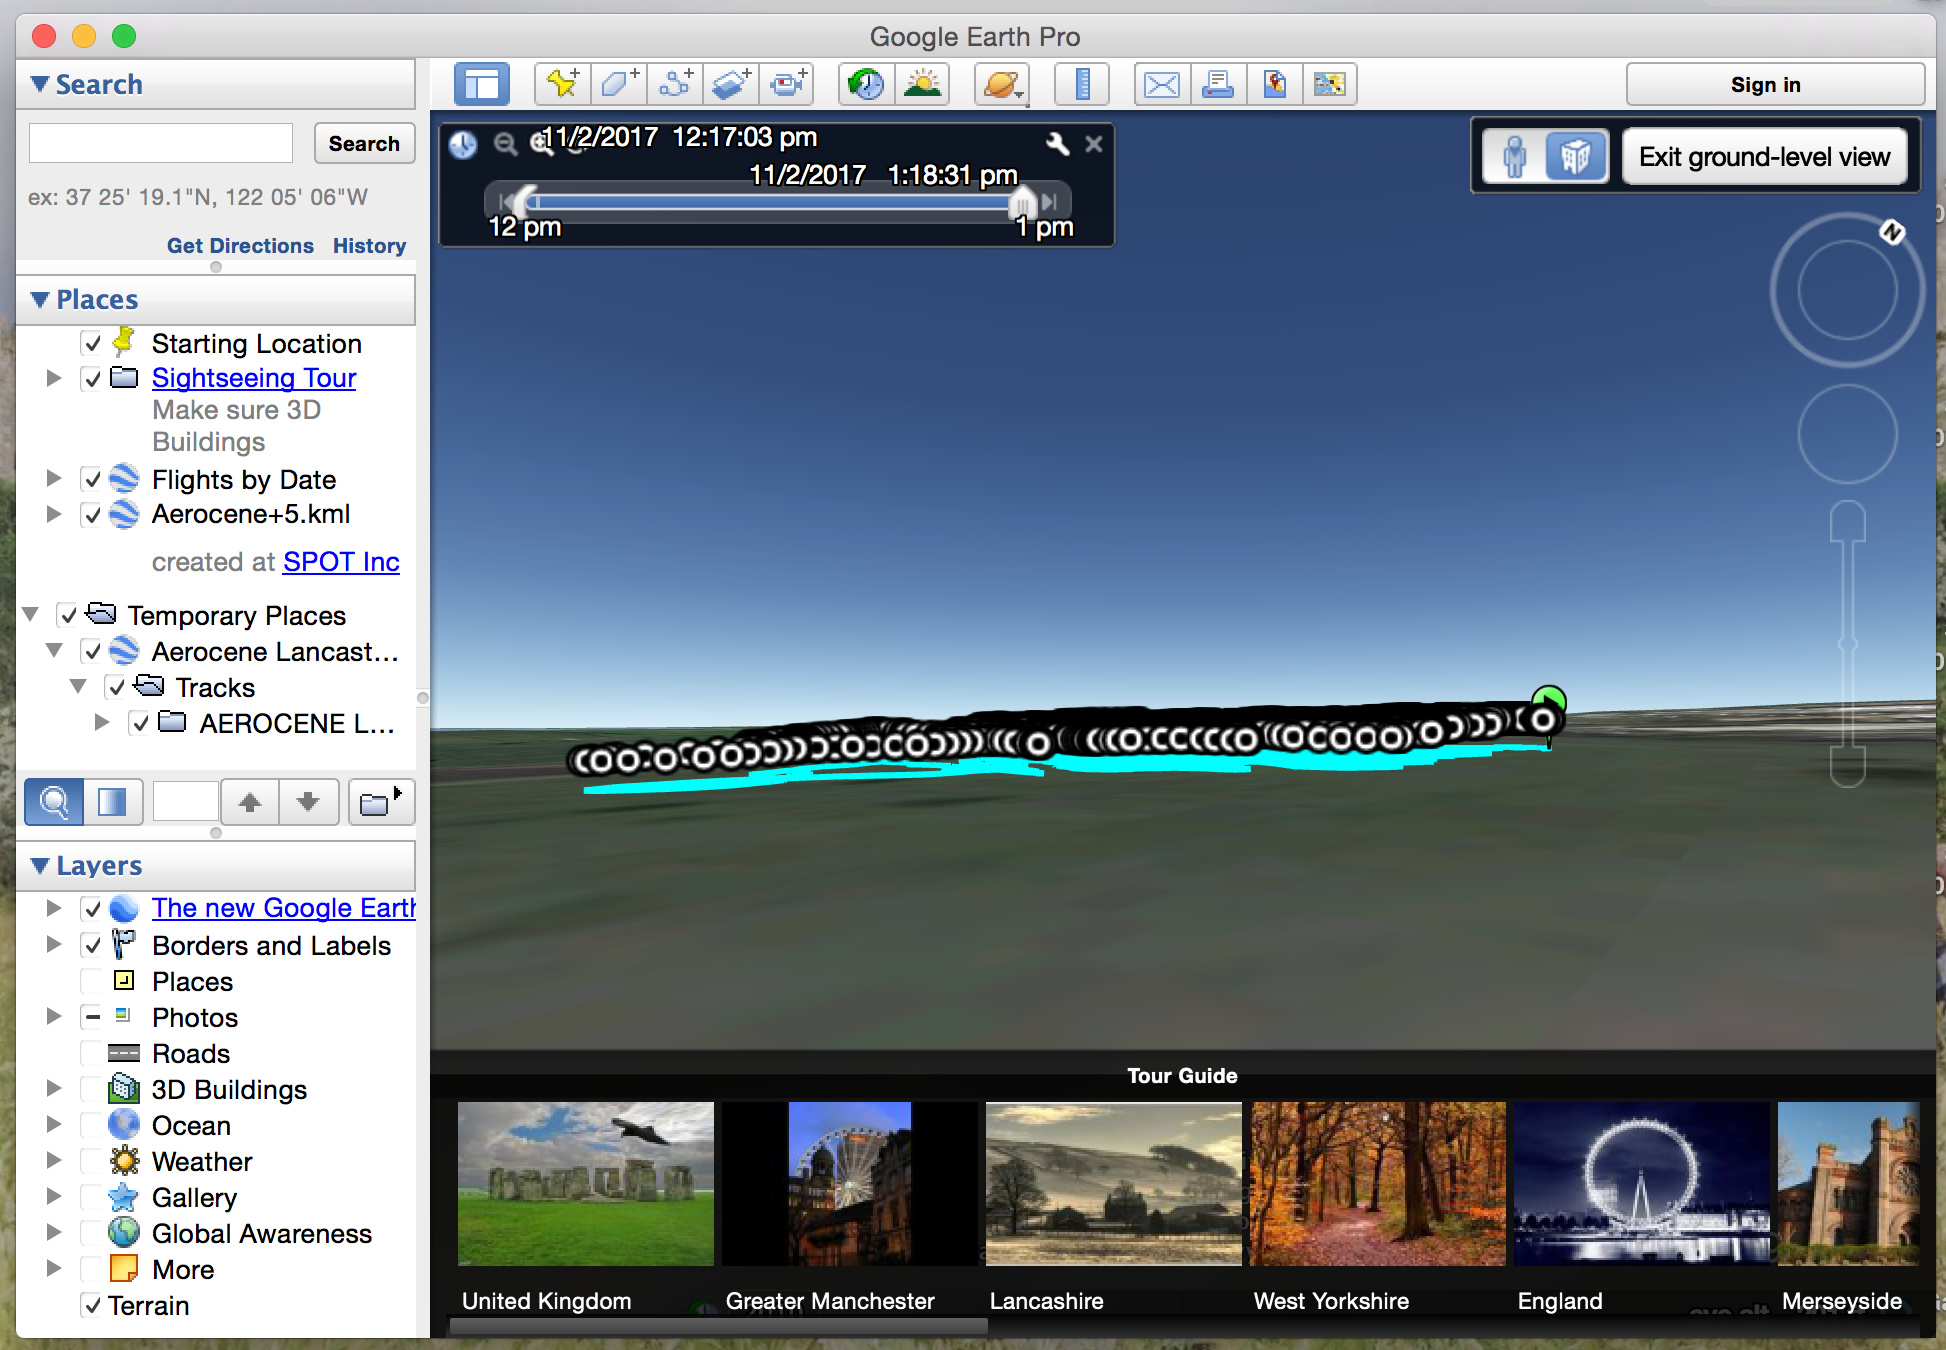
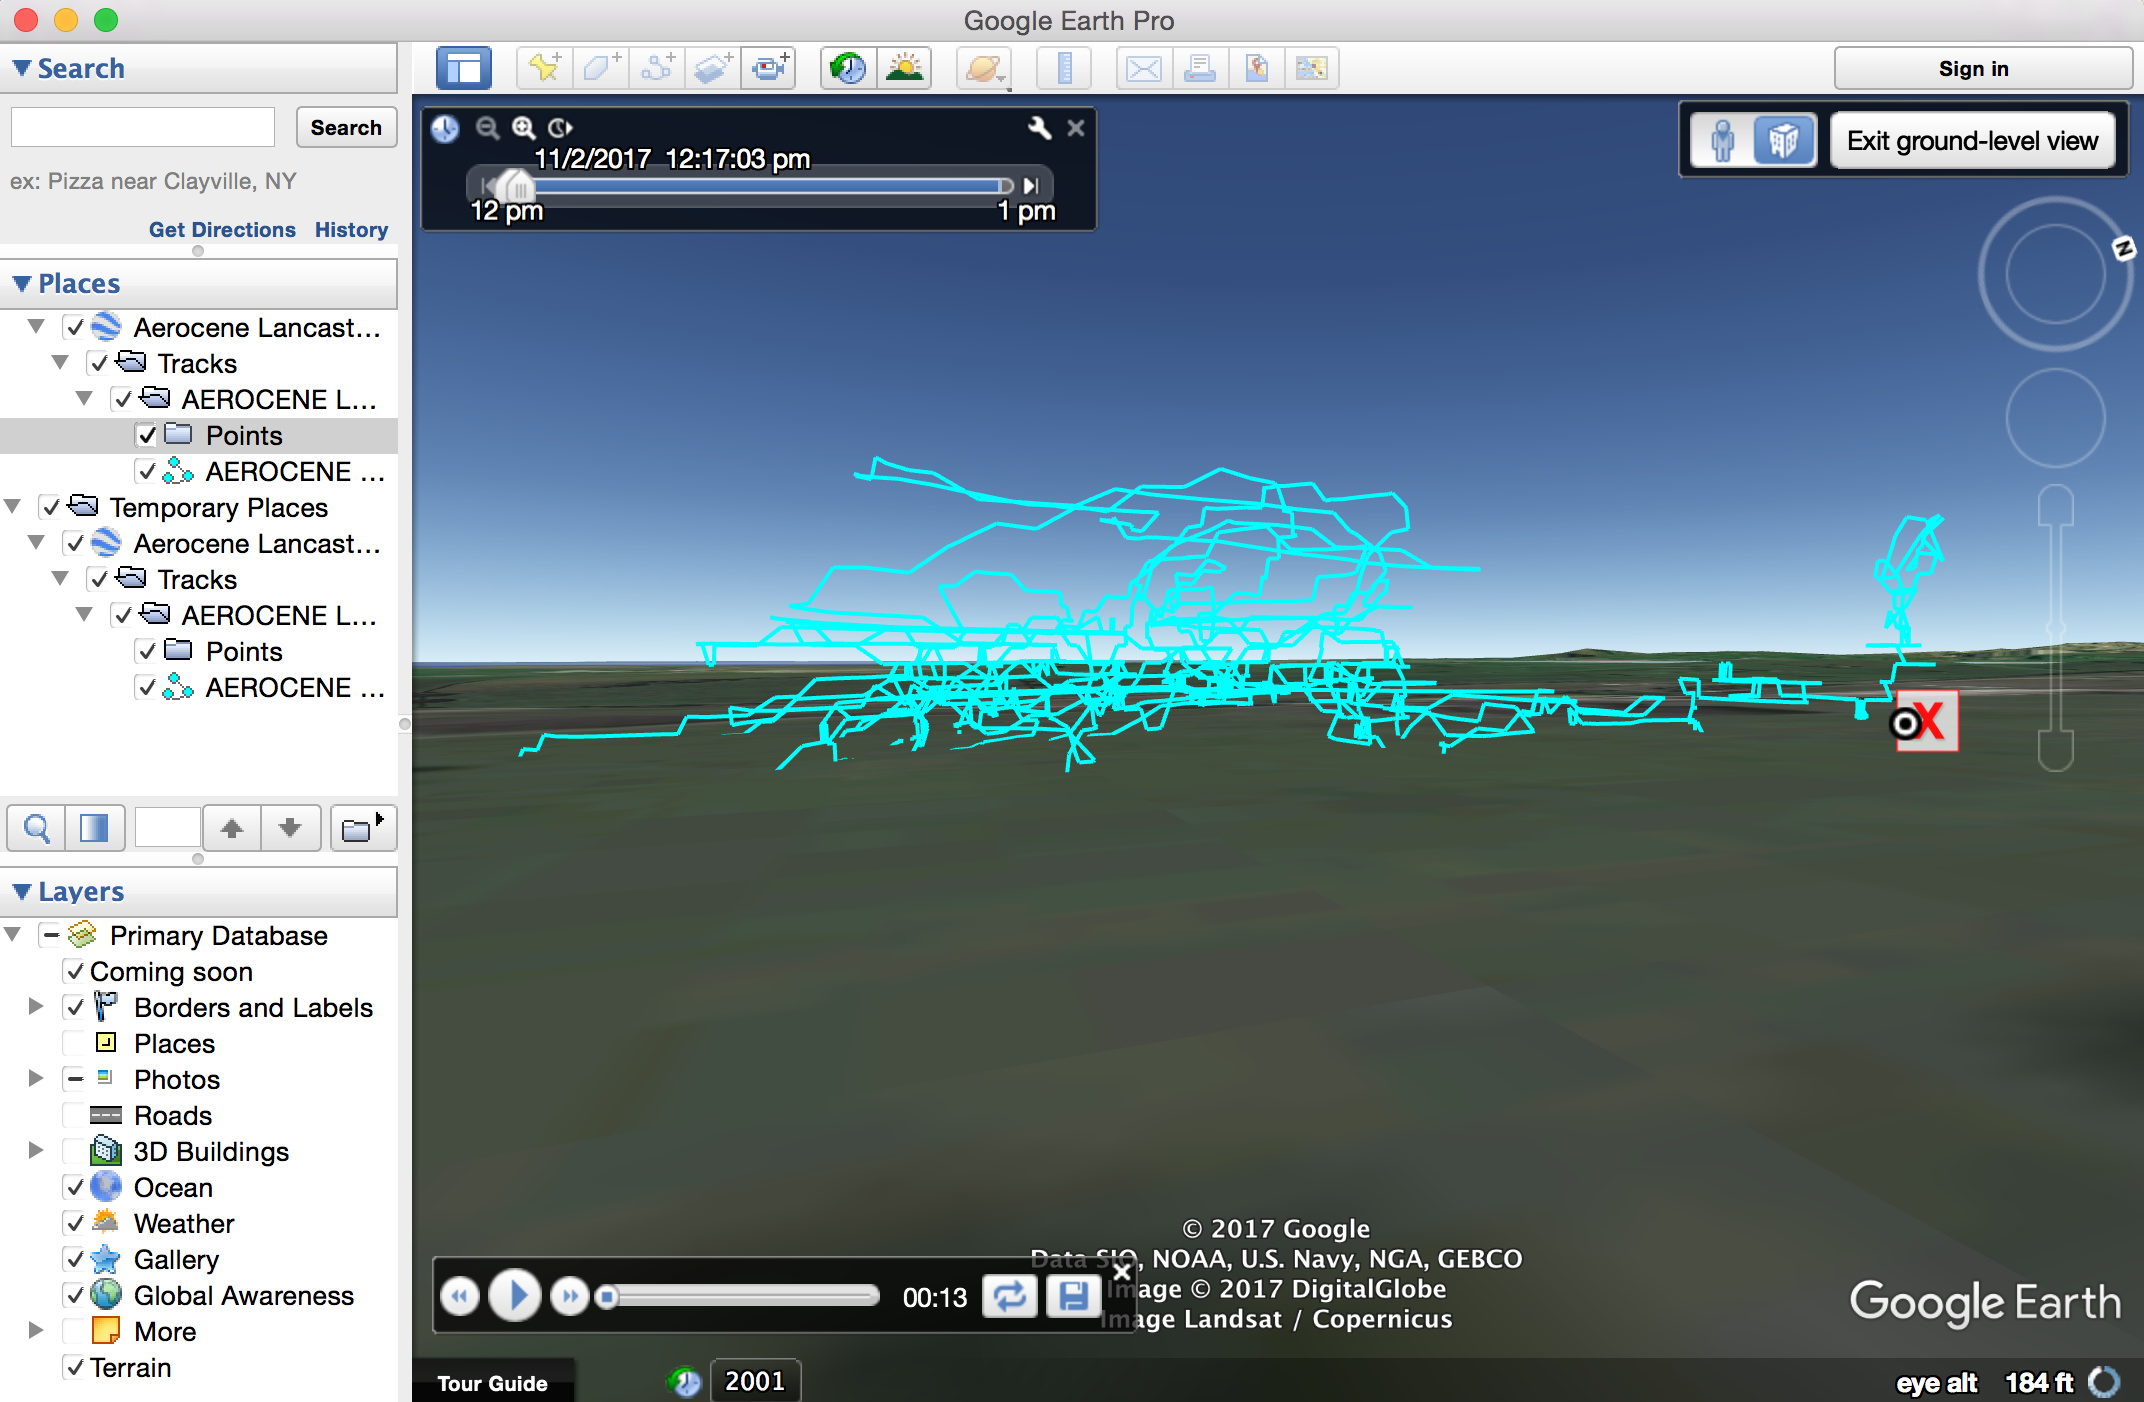
So now I have something like this:

I am curious - what are the dots along the ground? Are they GPS coordinates for all of the ‘points’ that were plotted by the Garmin?
I can get rid of them so that it’s just like this, but I’m not sure how I did it!
Also, how else can I represent the data? How can I analyze it? I would like to know how high the Aerocene went at its highest…
THANK YOU SO MUCH!
This has been a huge learning experience!
Warmly,
Sasha
On Fri 3. Nov 2017 at 21:54, Joaquin Ezcurra wrote:
Sasha! For sure! I will post the tutorial soon, just waiting to get my hands on Garmin GPS myself. Getting one as birthday present pretty soon :)))
Your questions are absolutely no hassle at all and I am super glad I can share my passion for visualizing the atmosphere.
Now to your questions:
-The dots you see are the projection of each waypoint or track record in registered while flying, projected on the ground.
-You can get rid of the point by selectively ticking or unticking options on the left hand side column on Google Earth.
-In order to analyze and get some more info on flight data such as maximum altitude, go back to Garmin Basecamp.
1- Open basecamp and select a trajectory from the left column, right click and choose Get Information
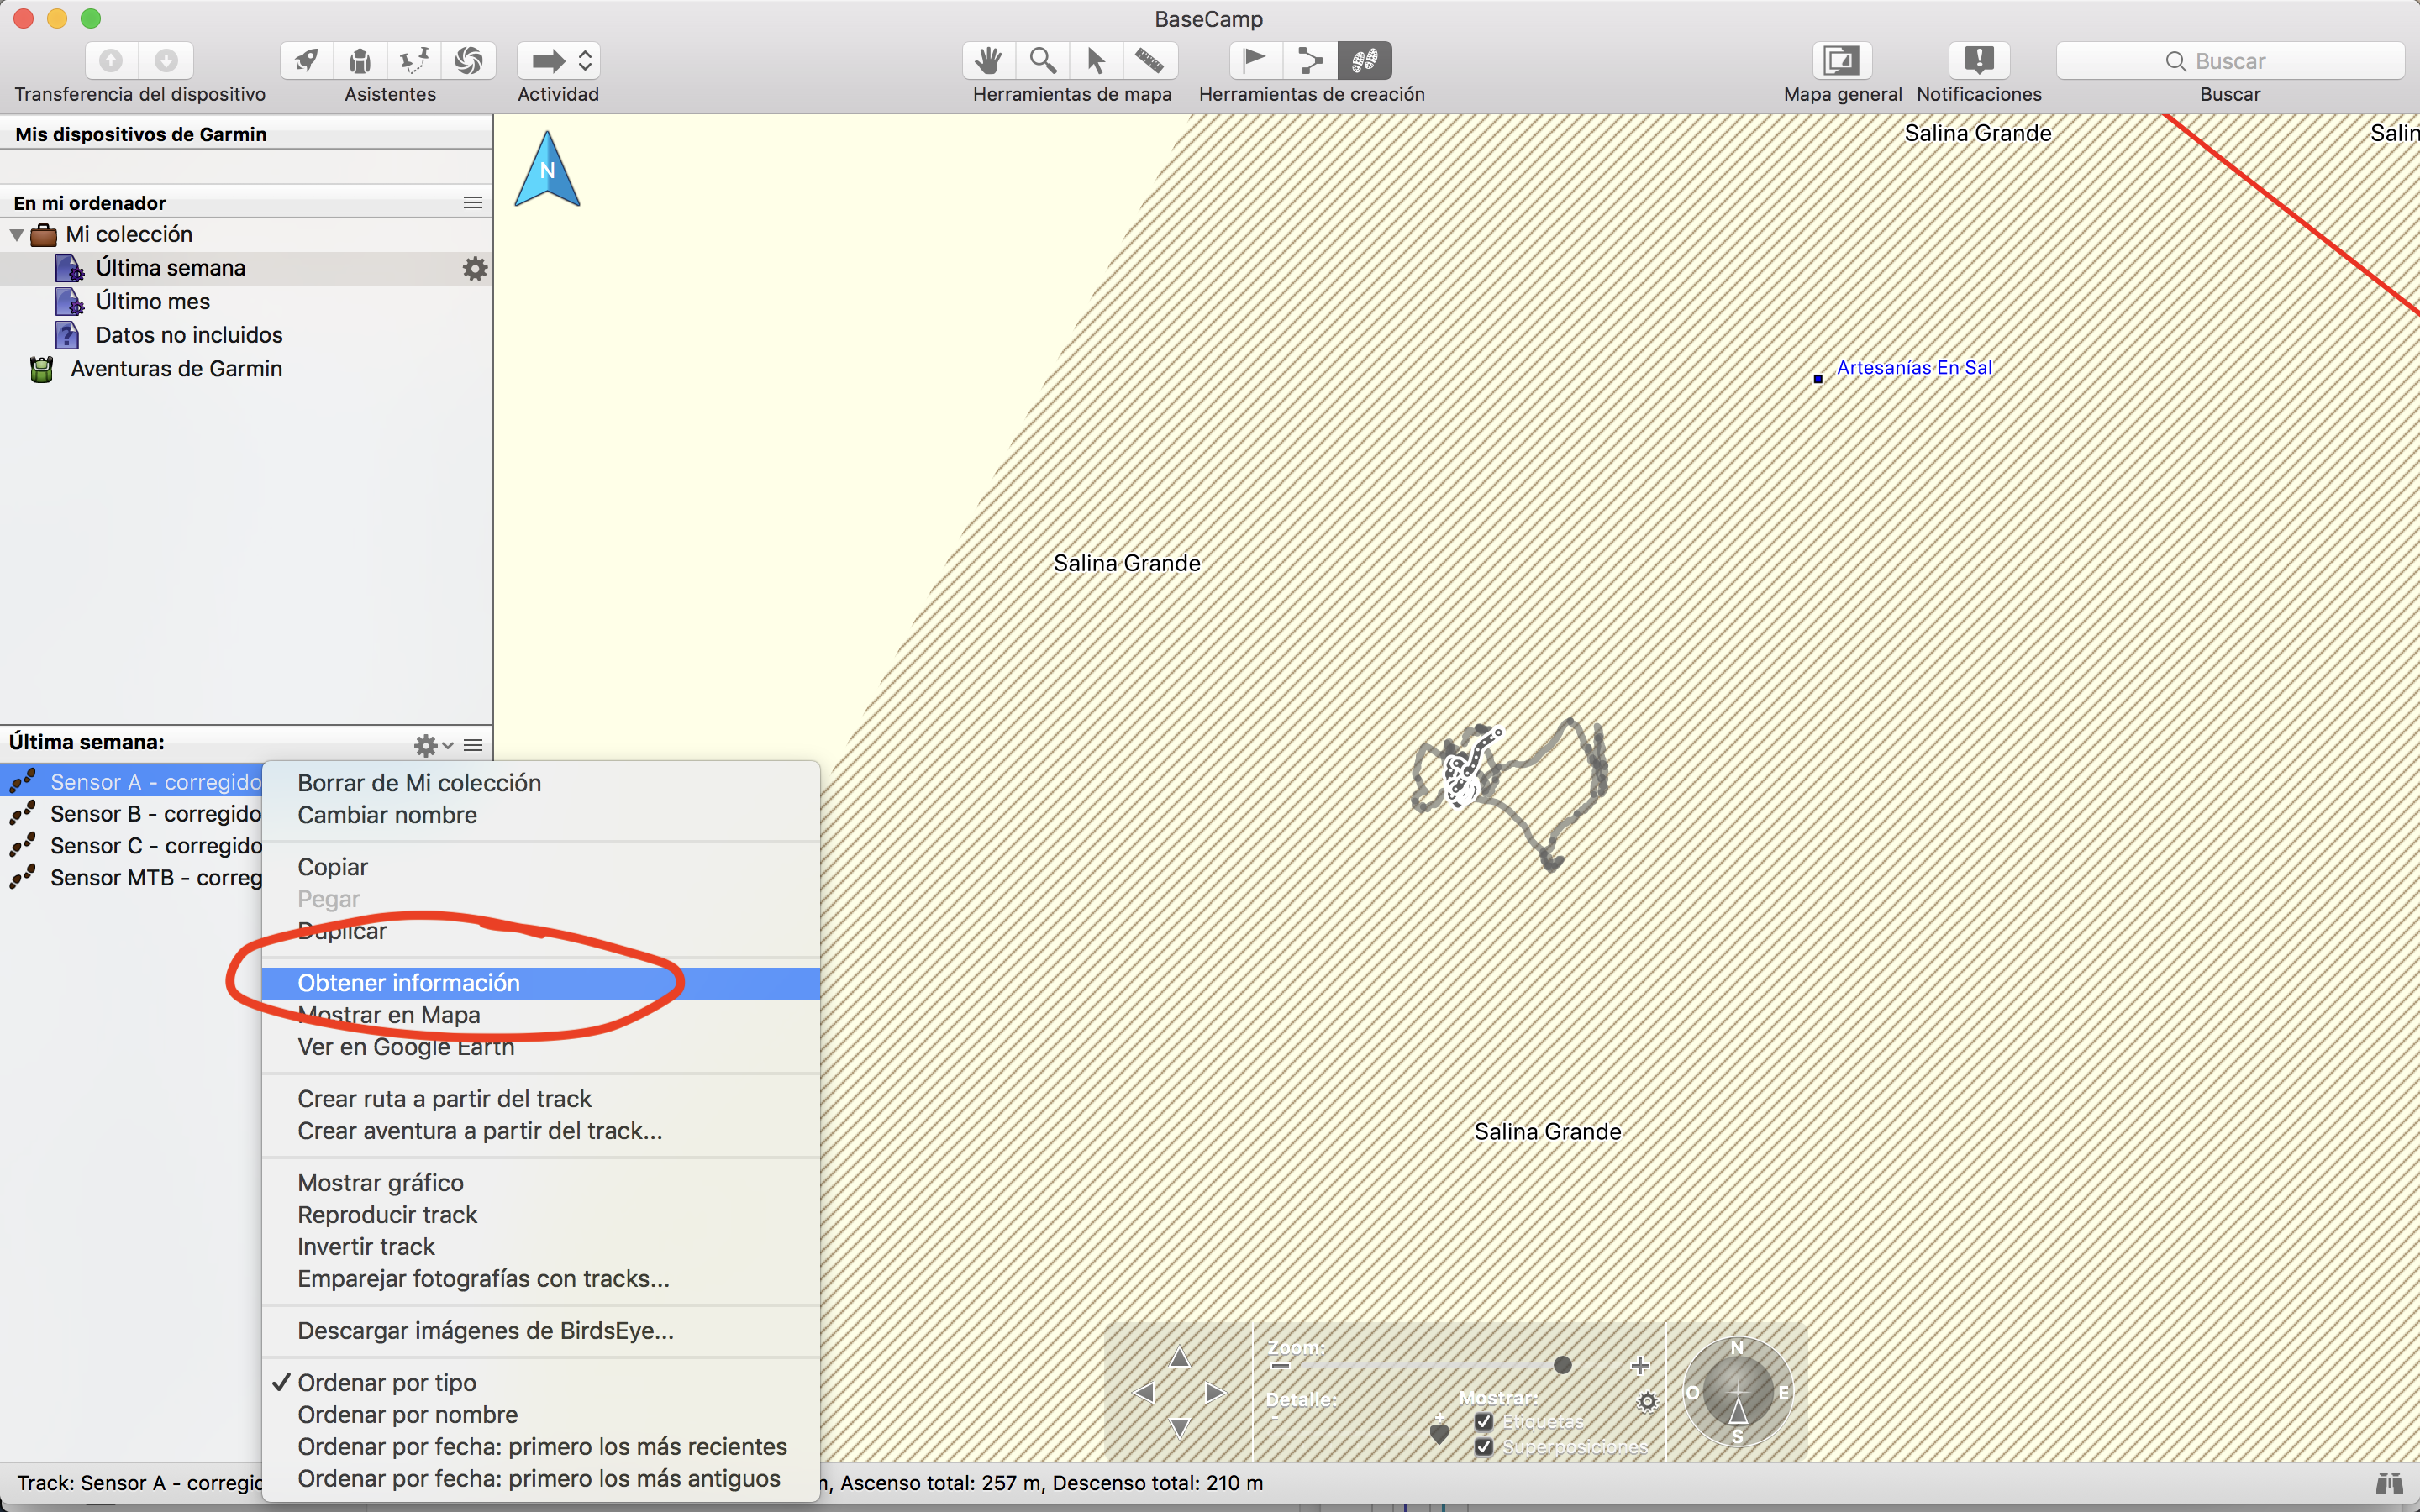
2- You get a window with the raw data, a list of point with coordinates and altitude.
Over here you can already sort columns by clicking on them, and star investigating the info.
For some more magic, click on the graph icon at the bottom left corner marked on the screenshot

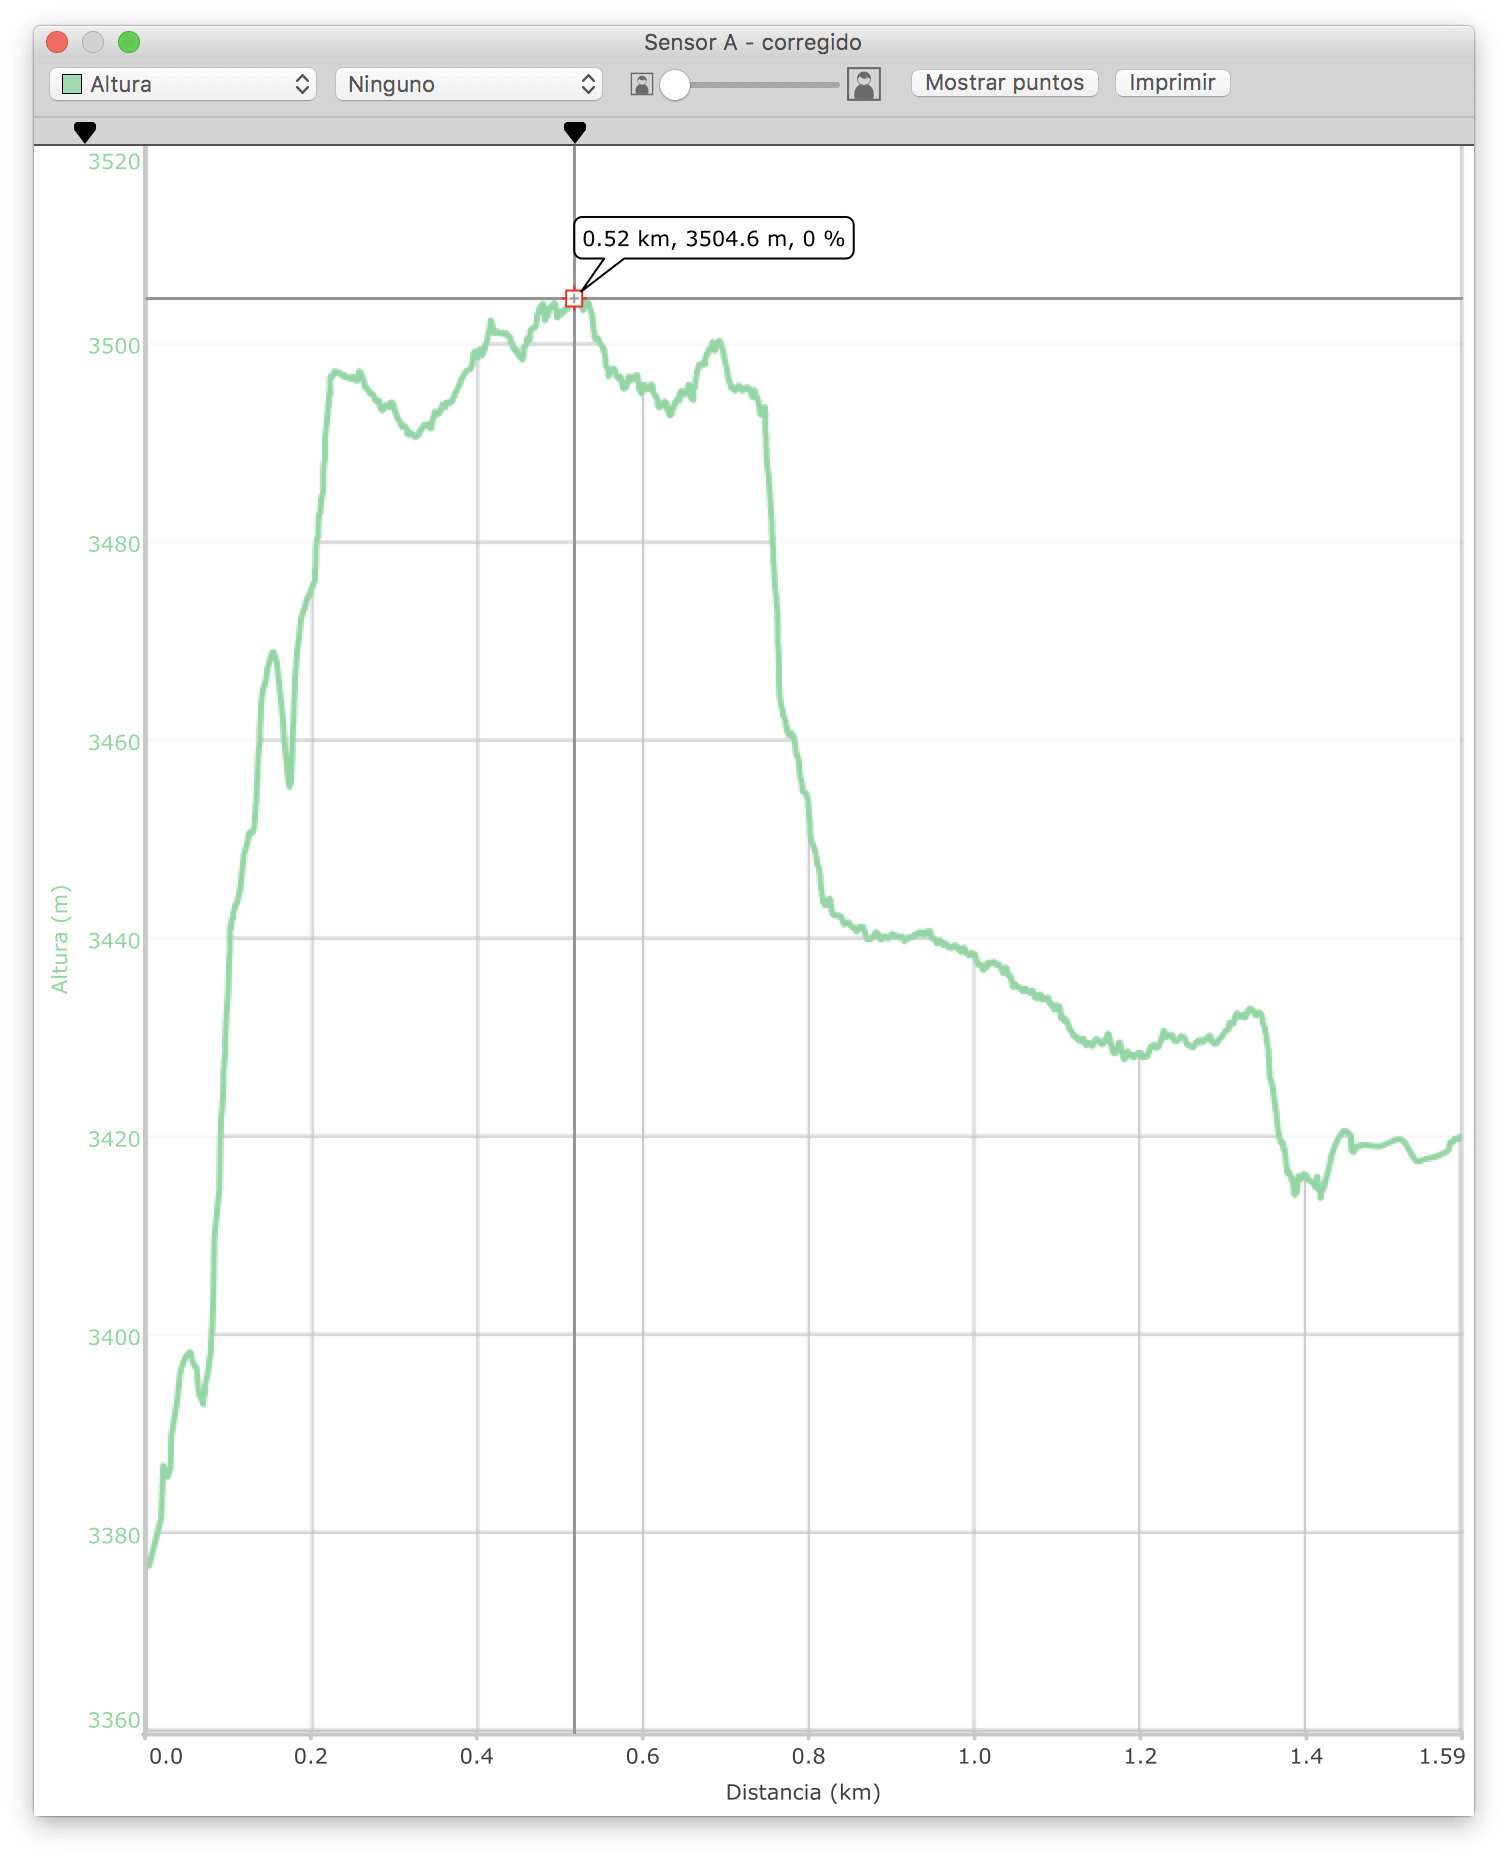
3- You are presented with a 2 tabbed window, the options are altitude profile and trip over ground visualizations
Now the cool thing about Basecamp is that you can click on the graph to get info for that very specific point, see below.
Once you master this, maybe we can progress to the next step, editing trajectories.
This way you could separate your flight into pieces and paint them in different colors.
It involves patience and basic fiddling with code, I really think anyone can do it because it would be cutting and pasting chunks of information.
Also Google Earth has a save as image option that allows you to generate an HD image with a cool desaturated effect.
I am keeping all this screenshots that will be part of the tutorial!
Also I am inviting you to the Aerocene Argentina forum which has interesting info both in english and spanish, including a primitive visualization tutorial > Signatures in the air - Aeroglyphs - Flight Visualization - Aerocene
Have a nice weekend,
Joaquin
2017-11-04 7:46 GMT+00:00 Tomas Saraceno:
Amazing Joaquin
Sascha Joaquin do you agree to copy this email exchange which is very friendly as well in forum as a draft x future instructions ???
I think encourage people to read and see how we help each other ;)))
And can comunícate openly somexquestion to sven etc etc :):))))
2017-11-04 9:52 GMT+00:00 Sasha Engelmann:
Hi Tomás,
Of course - I agree! Really happy if this conversation can be useful for others!
Best,
S
El 4 nov. 2017, a las 12:03, Sasha Engelmann escribió:
Hi Joaquin,
I tried what you suggested in Garmin Basecamp. It was fun!
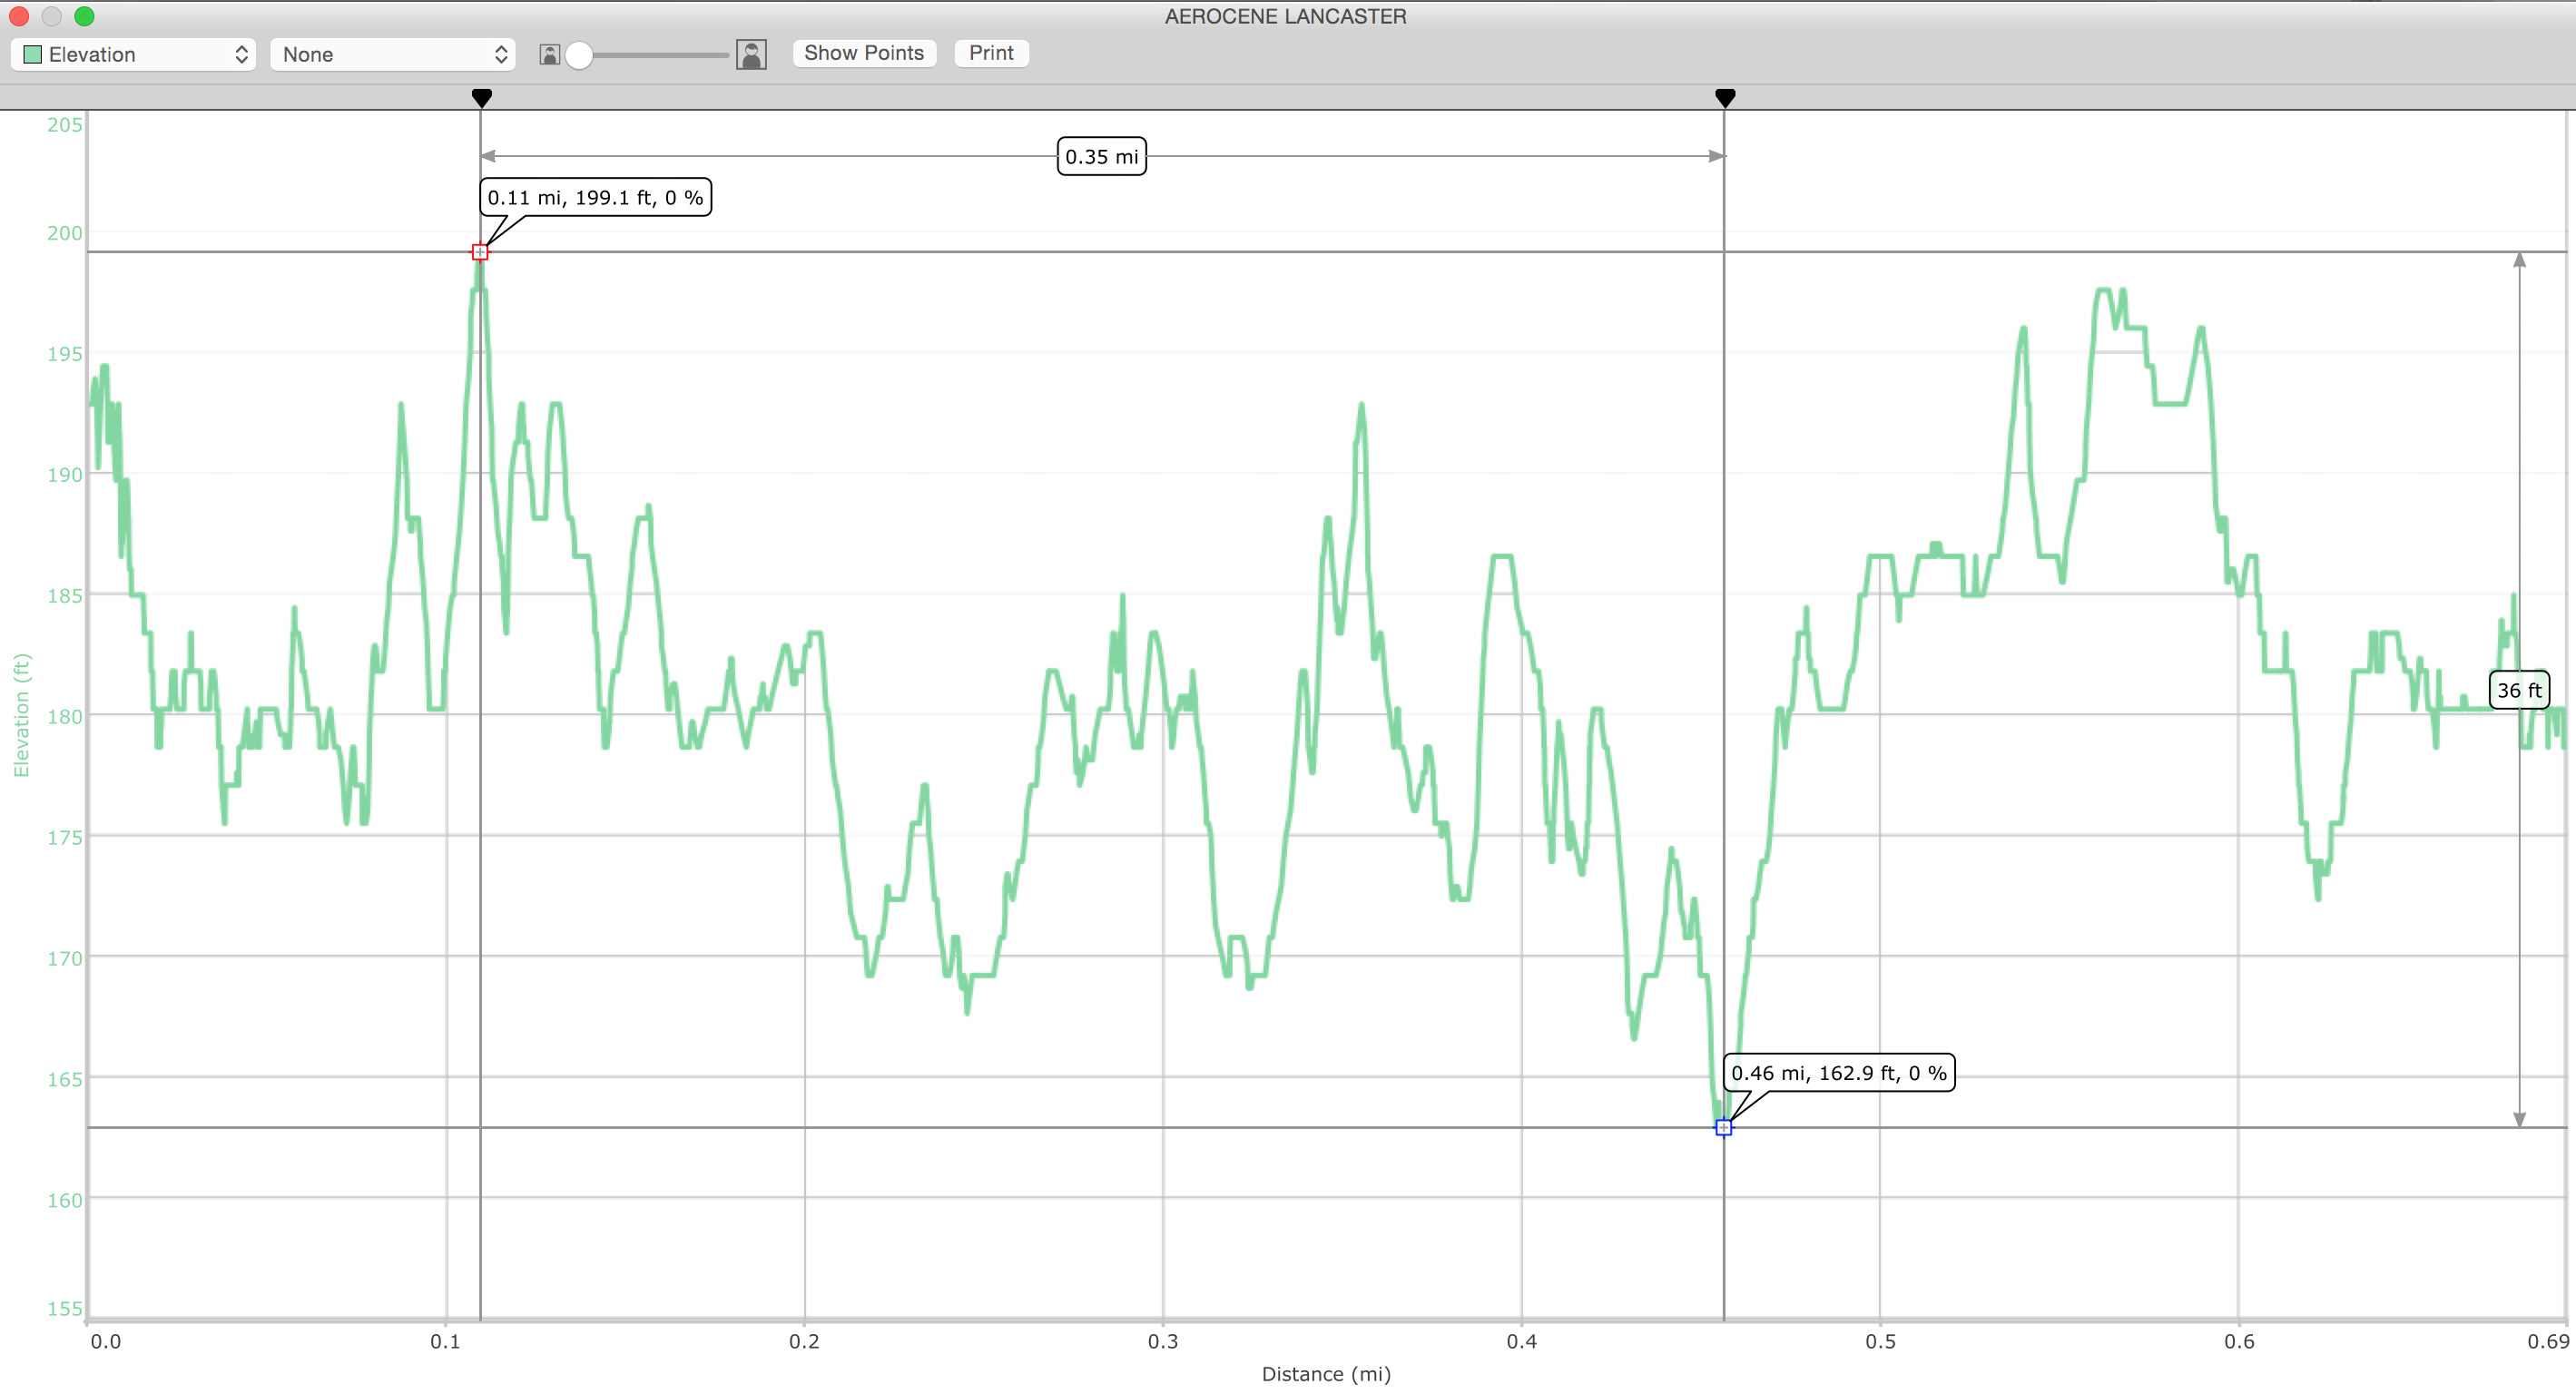
The raw data had a summary bar at the bottom which said that the “ascent” was 89 feet. However I am a little confused about how the ascent is measured, give that on the graph visualization that I will copy below, the distance between the lowest and highest point is 36 feet… also the lowest point is lower than the starting point.
The graph of the flight, with elevation on the Y axis and distance on the X axis, doesn’t read in the same way as the graph in the screenshot that you sent earlier, because the Aerocene sculpture is effectively moving back and forth around the same area, not necessarily traveling in a smooth trajectory across space-time.
I would love to learn how to analyze the trajectories and apply some more sophisticated visualization techniques. I am not a coder but willing to try and have always wanted to learn a bit of code anyway.
If it would help for me to send you the data that I have, I can do that. I assume I can export from Basecamp in a format that I can send you?
Thanks again,
Sasha
2017-11-06 18:44 GMT+00:00 Joaquin Ezcurra:
Sasha! How are you?
Regarding your altitude question, it might have to do with the fact GPS records altitude relative to sea-level, not ground level.
It would be great to have access to the data myself, you can export trajectory from Basecamp on GPX format.
Maybe we can gather some of the pictures from the flight and visualizations and publish an entry at the Aerocene site?
All the best,
Joaquín
On Tue, Nov 7, 2017 at 10:16 PM, Sasha Engelmann wrote:
Hi Joaquin,
Sorry for the delay - I had a full day of teaching at the university!
Here is the exported data in GPX 1.1 (attached)
Also, I have sent you an invitation to the Box folder where myself and a few other collaborators, including Grace Pappas, have been adding photos from the “Drift Economy” experiment and the Aerocene launch in Lancaster. So maybe there are images from there that would work for the Aerocene site.
Best,
Sasha
On Wed, Nov 8, 2017 at 12:36 PM, Joaquin Ezcurra wrote:
Hi Sasha! Here goes a preview of a visualization, where I inserted the Lancaster flight trajectory into a real-life picture.
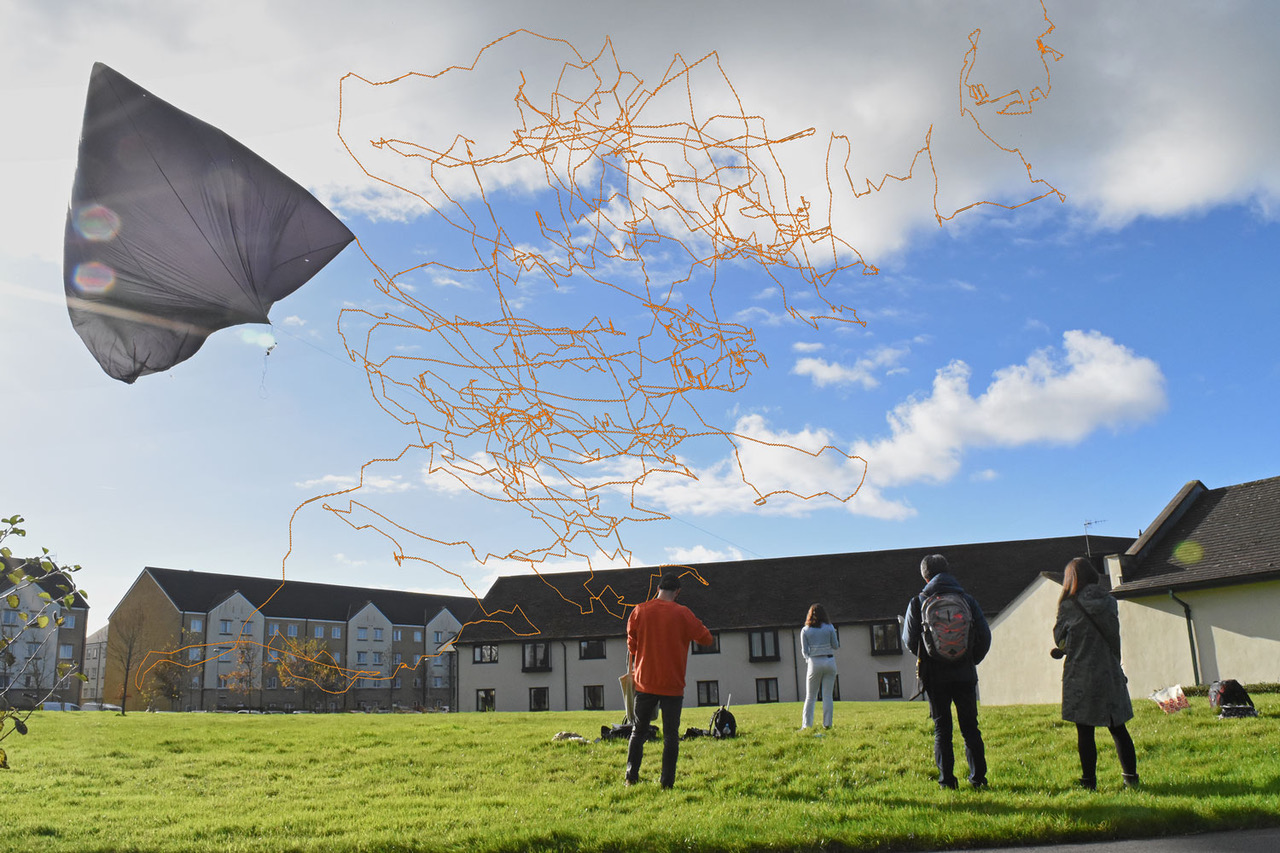
I have altered the perspective of the real trajectory to fit in the image giving emphasis to understanding what was actually going.
Nevertheless, I think this mixture of real picture and recorded trajectory serves the purpose of showing the atmosphere’s hidden sensitivity and delicacy revealed by the Aerocene Sculptures.
This is the first draft, should improve as I continue mastering layer masking in Photoshop ![]()
All my best,
Joaquin