Signatures in the air

Hi there!

As Tomas suggested, I am opening this thread to work on visualizing trajectory data from the Aerocene’s tracker.
The coordinates are stored in a weird format, here’s an example > -2336.5095, -6553.6714.
This format is actually the NMEA standard, which serves the purpose of communicating different marine electronics, for instance GPS and Radar information into a plotter. As per the NMEA standard fact sheet, coordinates are expressed in ddmm.mmmm, which is full degrees and minutes with decimals.
This is horrible for processing, since we have to achieve the following operations to convert to KML file’s more standard degrees and degree decimals. dd.dddd.

1- separate degrees > -23 from the above example
2- divide the remaining digits by 60 > 36.5095/60 = 0.608491666666667
3- Add this result to the degress > -23.608491666666667

It looks easy but accomplishing this for a batch of hundreds of GPS fixes is not that easy.
In my case, I am using Excel in spanish, I figured out the following formula:
=-(CONCATENAR(IZQUIERDA(A2;2)&"."&(DERECHA(A2;6)/60))/10000)

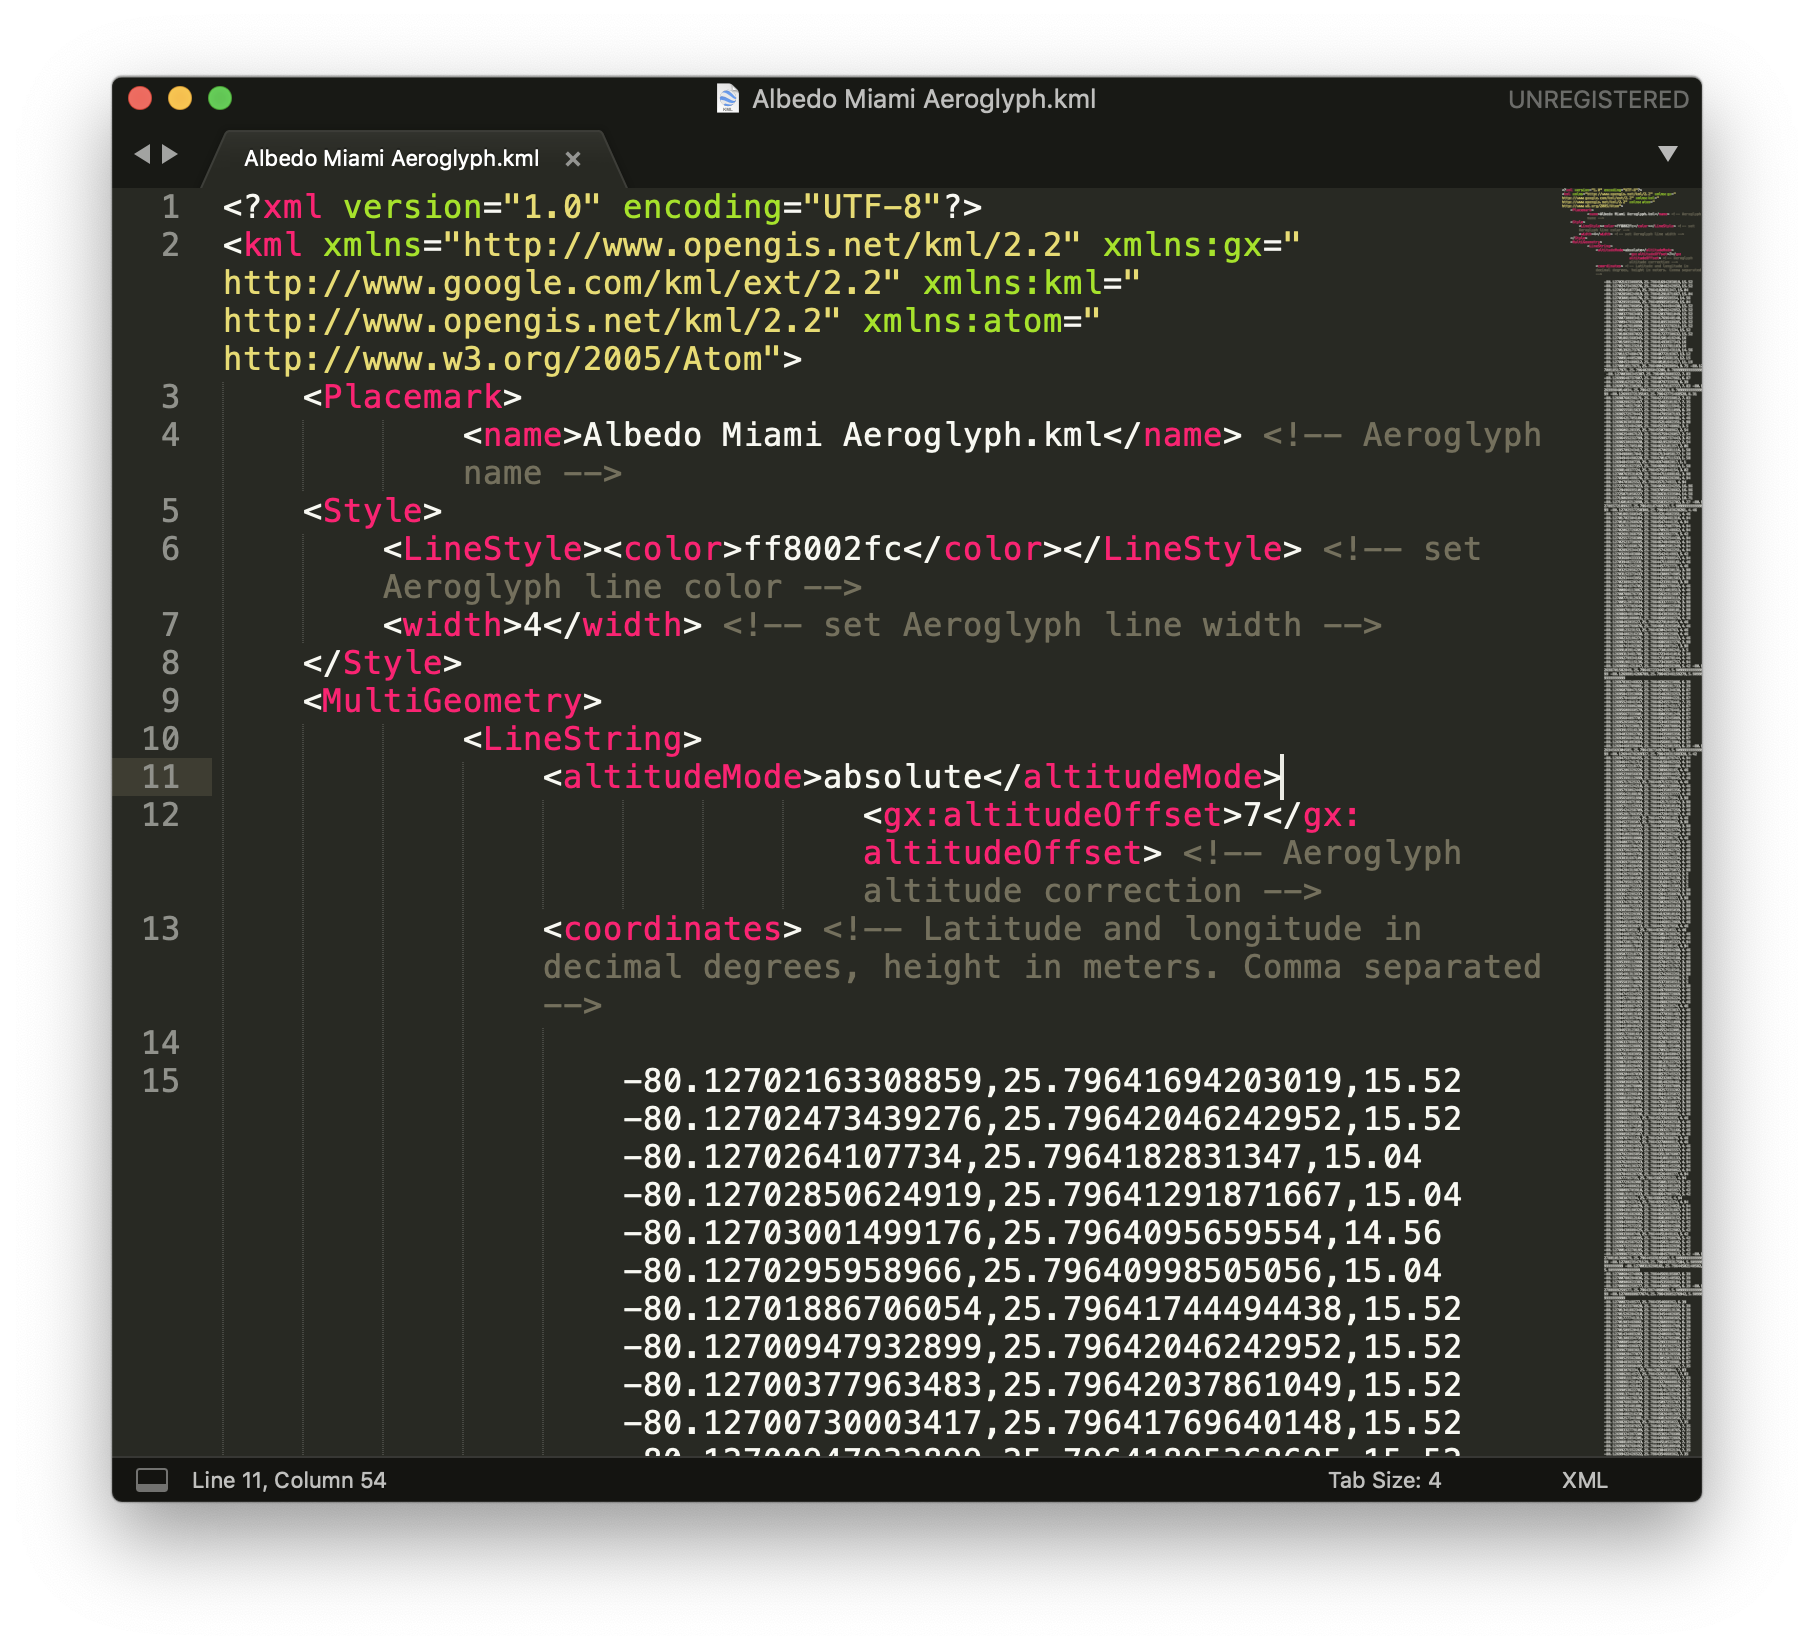
Now, once we have this values, we need to generate a CSV file (Save as Comma Separated Values) with just latitude and longitude information. Once this is done, we open the CSV file with a simple text or code editor, like Notepad, Text Edit or Sublime Text. From this file, just select all and copy. In order to edit the KML file, replace with your own coordinates information where relevant, close and save.

Regarding the sensor itself, and apart from the complex NMEA coordinates output, it separates the information into several files, which adds another step in order to join the GPS coordinates of a day of flight.
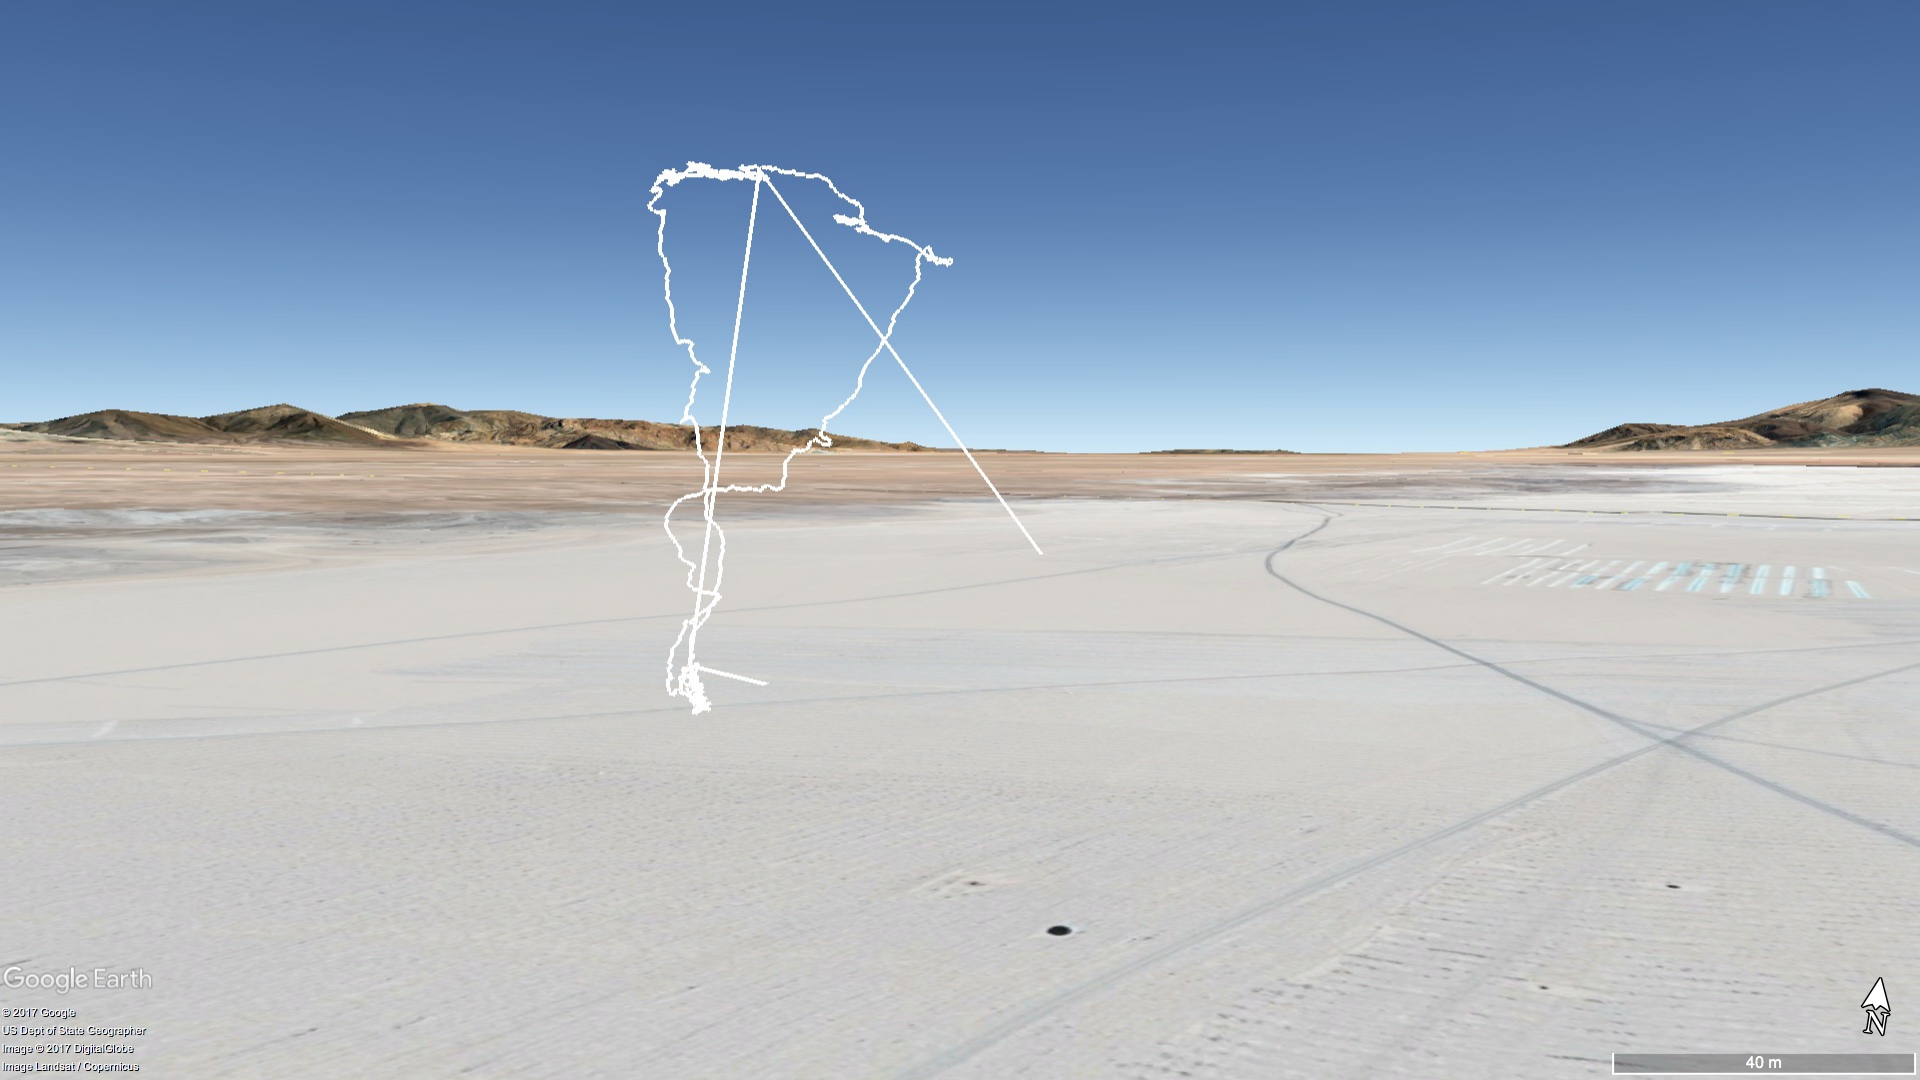
One other mistery I cannot understand, is that in order for the Salinas flight visualization to be accurate, I had to position first the longitude, and then latitude, otherwise it would display the wrong position.

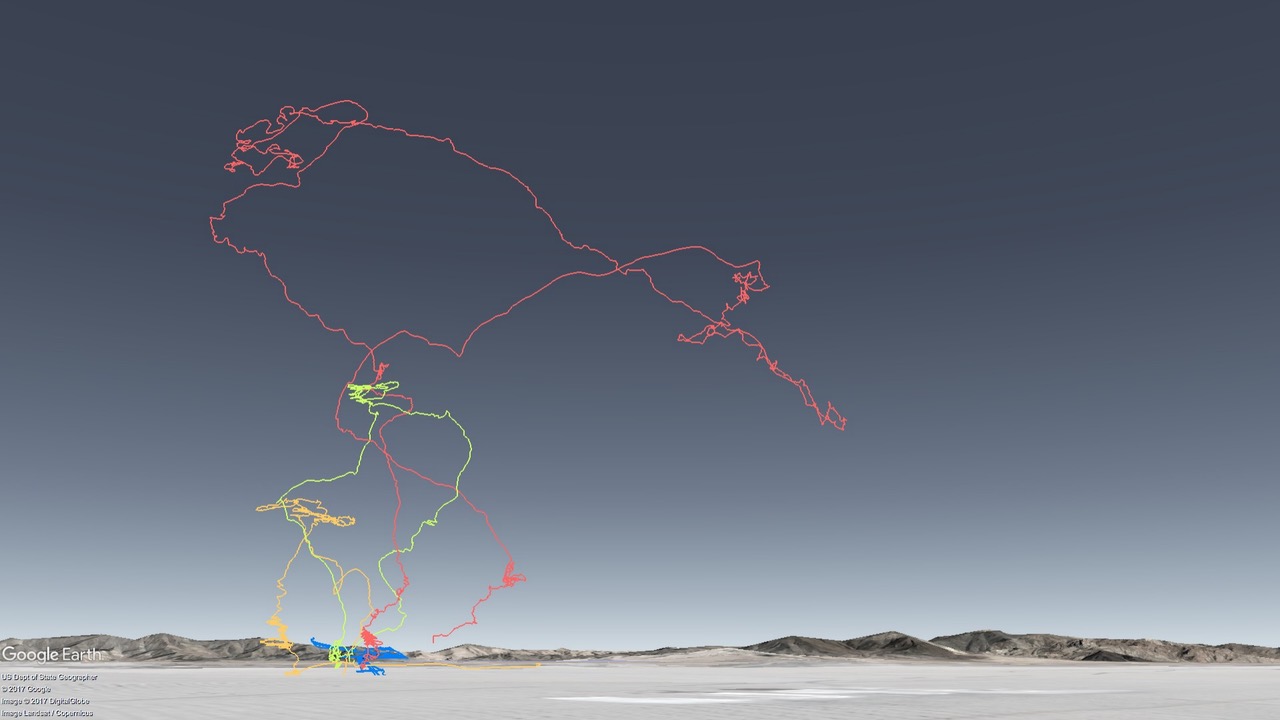
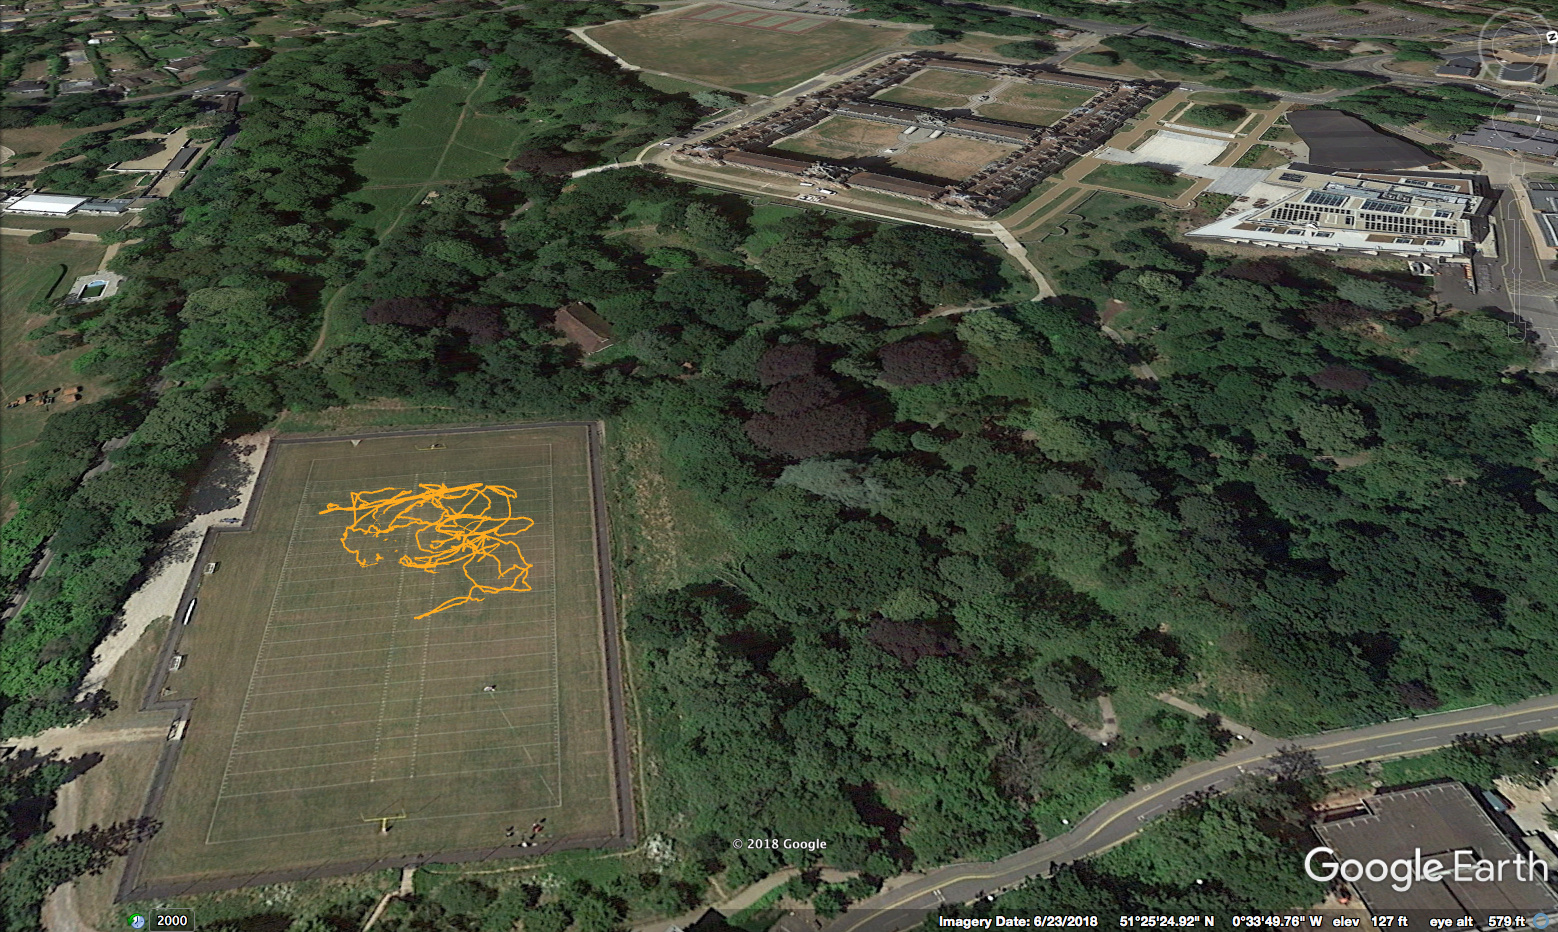
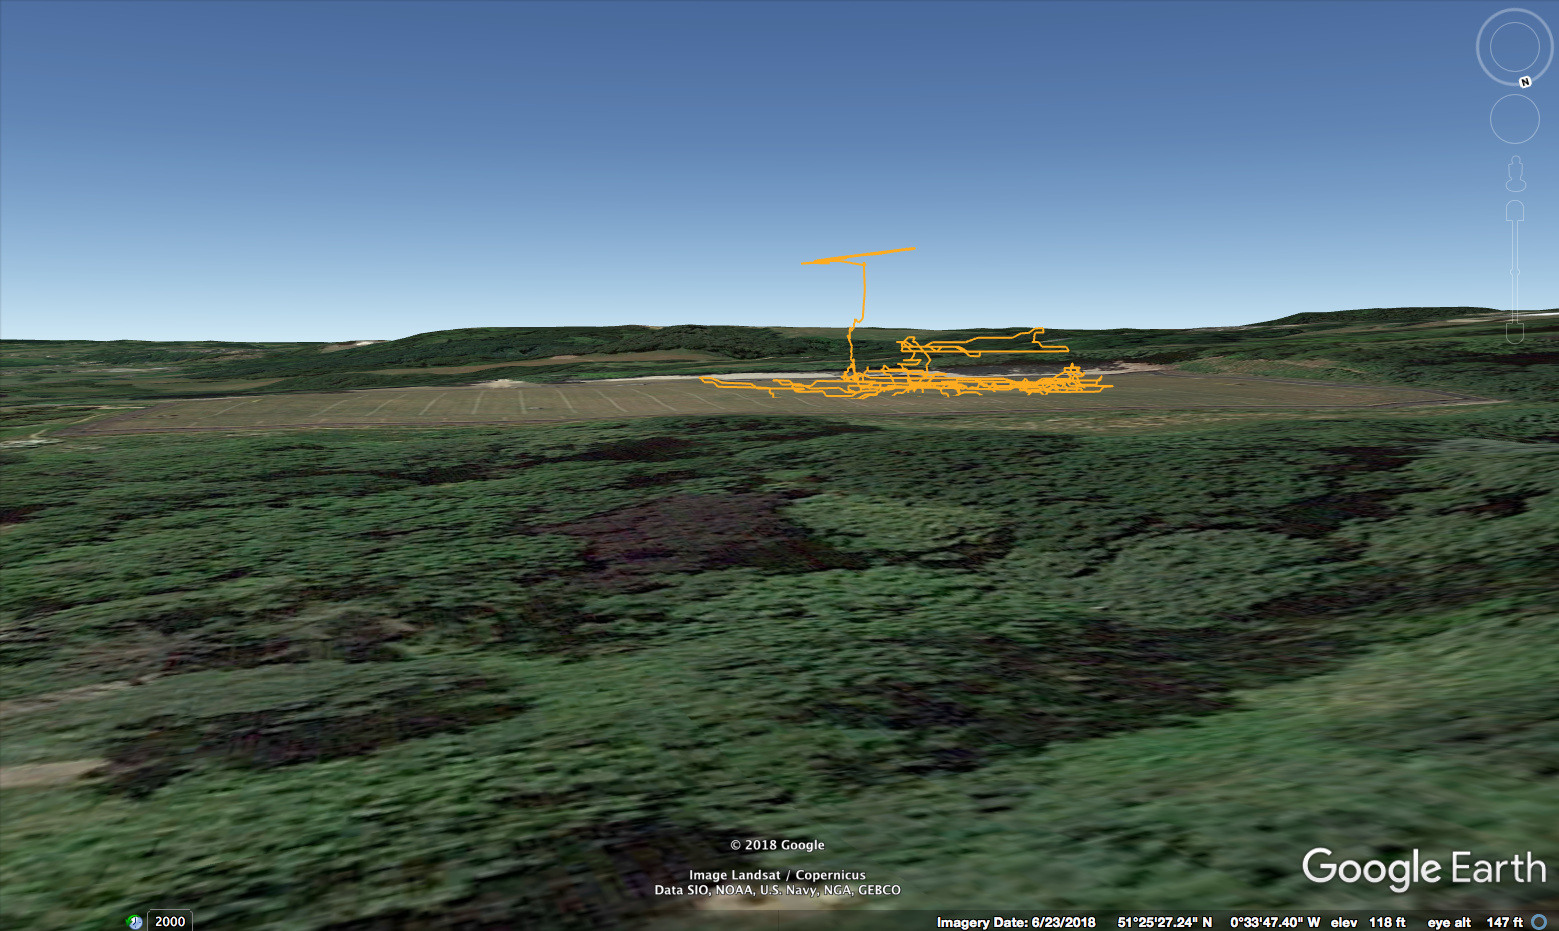
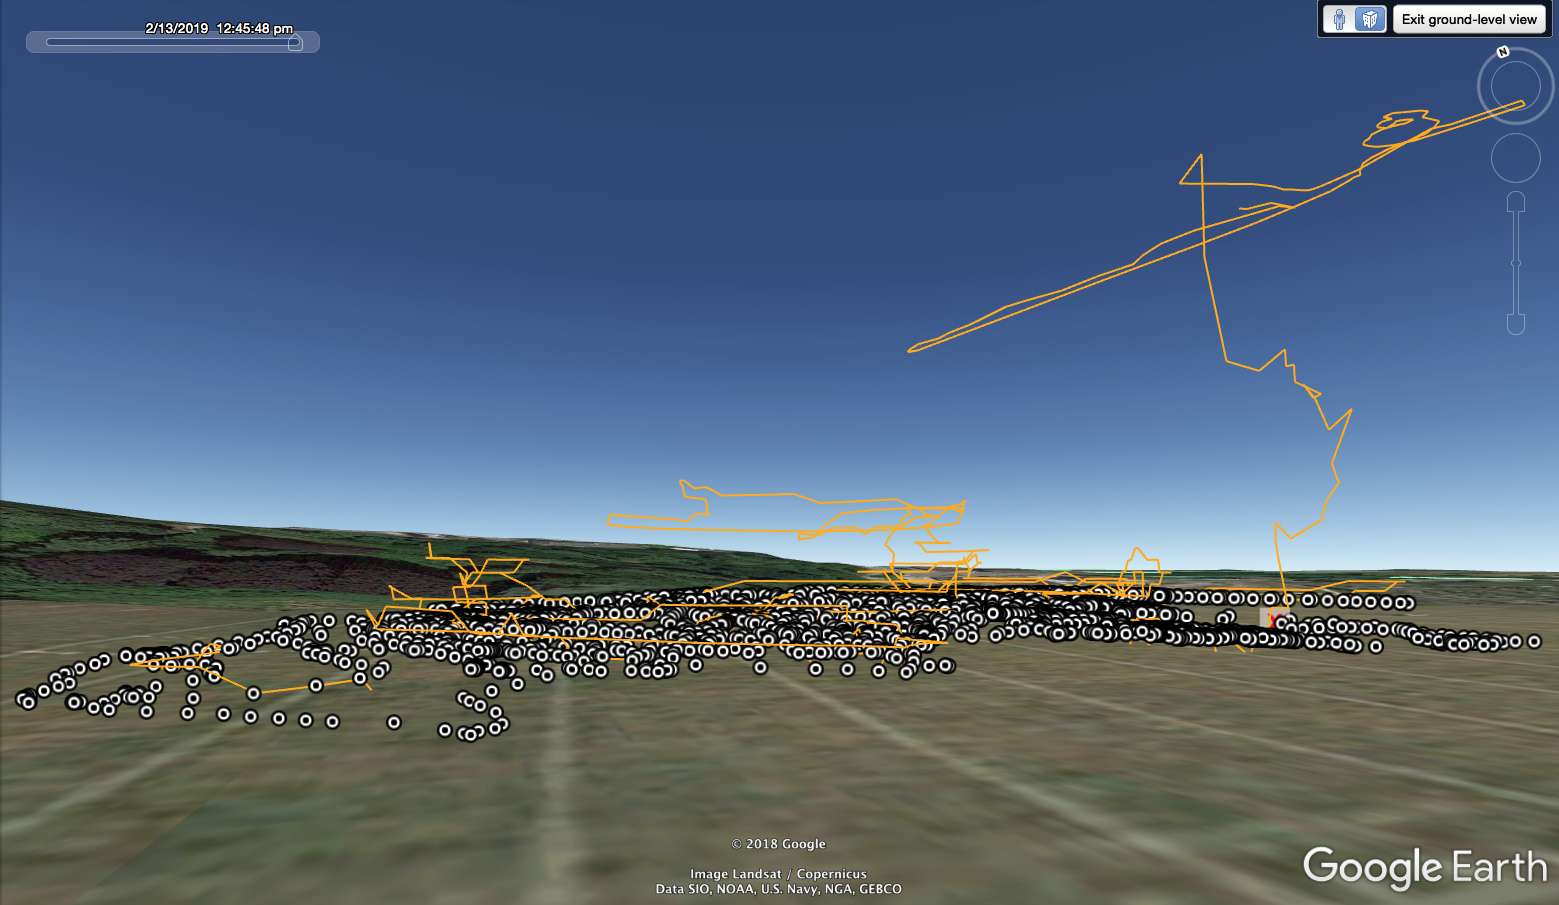
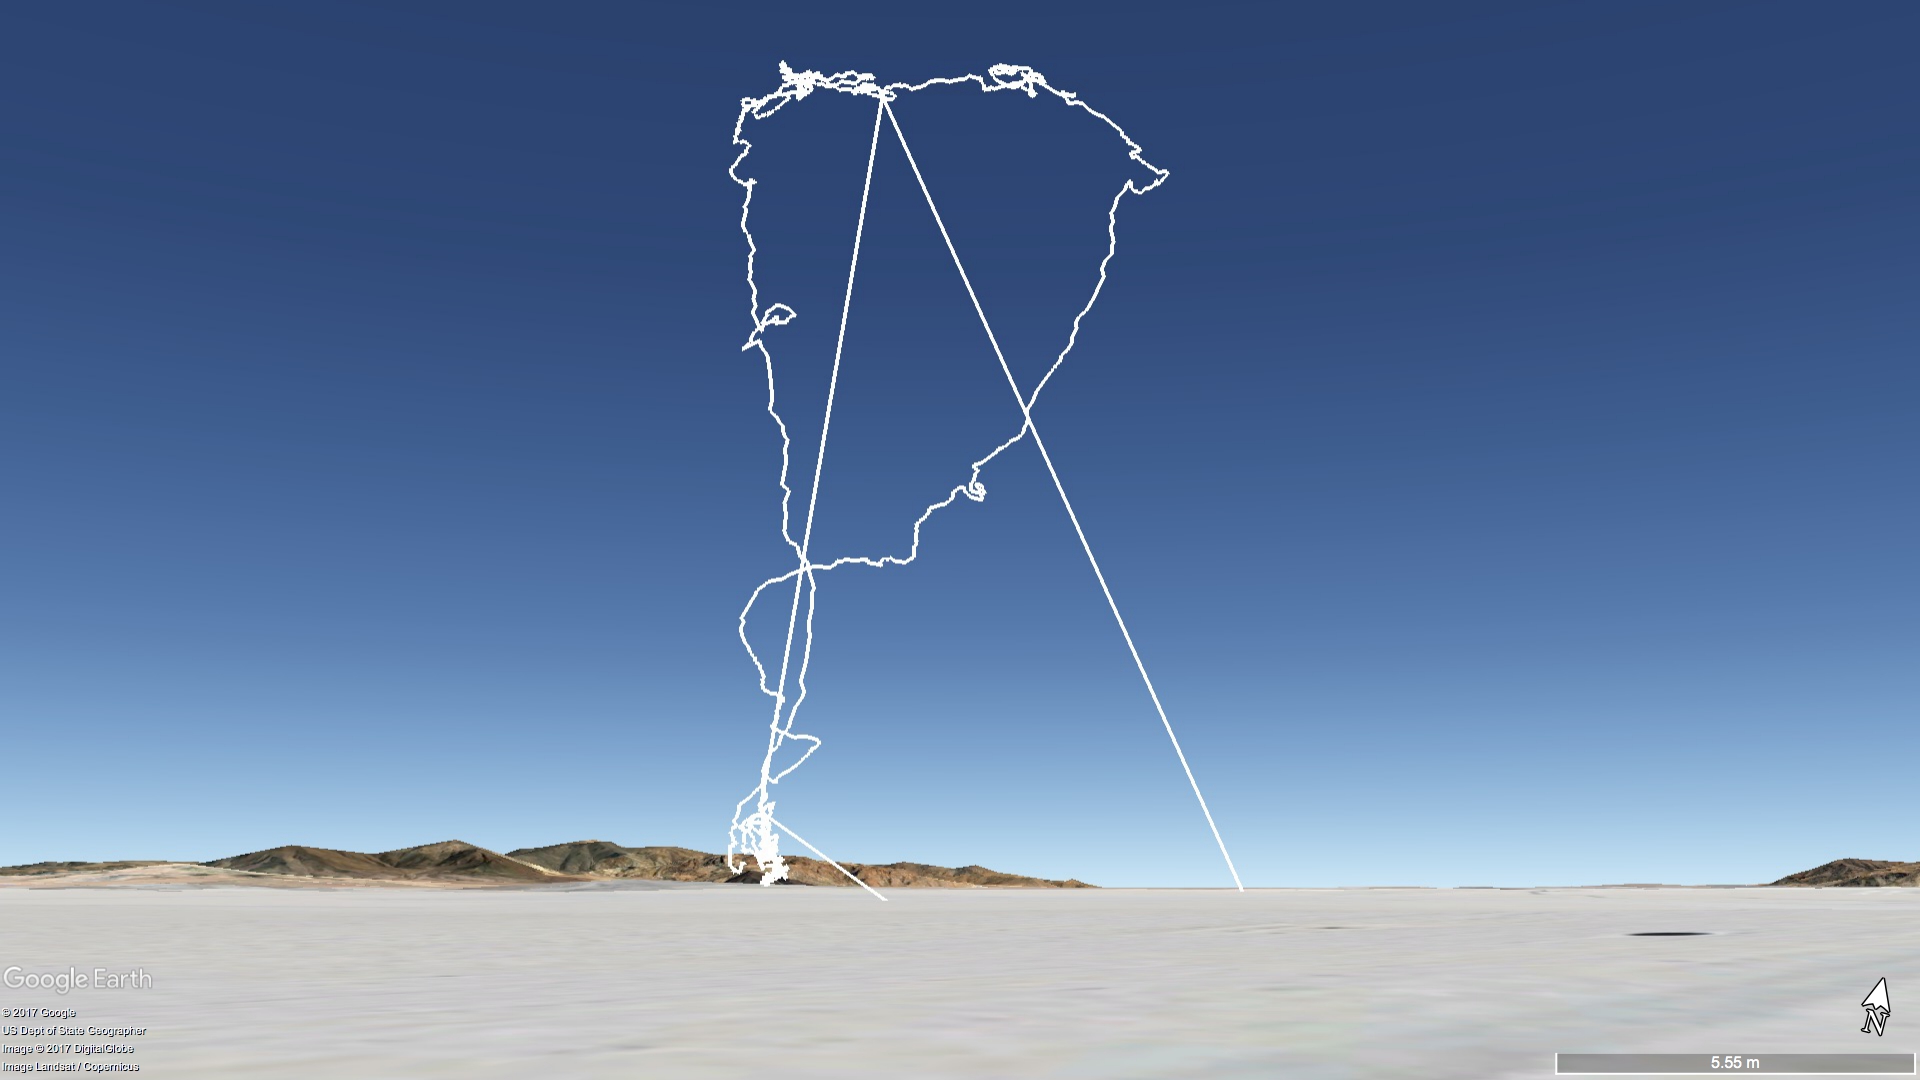
This are some of the images I generated, in this case something interesting is the vertical line that goes from the balloon to the floor, that’s a sensor falling! The diagonal lines seem to be data inconsistencies.

I am also attaching a folder with all the data registered, so if anyone wants to give it a go at visualizing some of these flights > https://drive.google.com/drive/folders/0BxeRuoA9n2GlVEs3alJCT2V5RFU?usp=sharing

Hope we can all work collaboratively to improve this results! un abrazo

1 Like

Hi! we’ve made progress in the past week in the field of visualizing Aerocene flights tracking info.
Most significantly:

  • Bill Clark, from EarthPoint.us, has granted the Aerocene Foundation a license to his online coordinates batch conversion tool. No more hassle going from NMEA to Decimal degrees coordinates :))))

  • As most trajectories contain invalid data, it is vital to be able to edit a KML track. For this purpose, I have succesfully experimented with Garmin’s free Basecamp application.

  • Also notable, we can fly past an Aerocene’s balloon flight trajectory using Google Earth’s in-built fligth simulator -let’s not forget to have fun!
    https://www.dropbox.com/s/qo8rhm3861a84g5/sobrevuelo%20sensor%20C.mov

before flight

  • check tracker’s battery

  • make sure tracker’s sd card is empty, if not, save the information on to a computer and then empty the card by deleting all files

  • it is worth setting the tracking on for 10 minutes, then retrieving that data an then comparing it to another gps’s data. what are the relationships with the different fields on both files? are coordinates, height and time being stamped likewise on both files?

during flight

  • keep a blog (traditional sense of the word, not an online one). make sure you have registered everything related to flight operations. which balloon corresponds to each sensor? for each sensor: time of take off, time of landing. this is vital in order to process flight data and generate signatures in the air

after flight

  • download all flight data from sd cards into corresponding folders. keep everything tidy as much as possible.

  • now that you have your data, it is time to compare the data to the records on your flight day blog: your objetive is to isolate the flight tracking info solely for the time spent by each balloon flying. we will only be using latitude, longitude and height to process the flight trajectory visualization. tools of the trade (free or opensource):
    _ LibreOffice for the main editing CSV files > https://es.libreoffice.org
    _ TextEdit, NotePad or Sublime text for editing little things, like replacing commas for points, or adding a minus sign
    _ Google Earth to visualize the trajectory as a KML file > https://earth.google.com/download-earth.html
    _ Garmin BaseCamp to edit the trajectory once you have been able to visualize it > Descargar BaseCamp | Garmin
    _ Add your own!

  • once you have a CSV file with the flight values, you need to get rid of the unwanted columns such as speed, satellites, just leave latitude, longitude and height.

  • time to convert coordinates from NMEA to decimal degrees. Head to EarthPoint batch convert tool: http://www.earthpoint.us/BatchConvert.aspx. Send me a private message through the forum and I will send you the required login credentials for unlimited batch conversions.

  • it seems you now have the required data! open the file with a text editor and copy all the comma separated values

  • open a previous flight KML file with a text editor, then replace the coordinates with the ones from your recent flight.

  • save, close, and open KML file on Google Earth

We have compiled a lot of interesting screenshots from the process into this PDF file, feel free to check it out: Dropbox - File Deleted

1 Like

excelente! muy muy bueno

Trayectorias de los vuelos Aerocene con Sensores A, B, MTB y C, Salinas de Jujuy.

Si alguien quiere interactuar con las trayectorias de vuelos, acá dejó el archivo KMZ para abrir con Google Earth > Aerocene Jujuy flights.kmz (62,4 KB)

1 Like

I copy suggestions from super geniuses Nick Shapiro & Liz Barry

  • Flight signatures will be generated automatically upon data upload
  • This can be made possible by developers pushing data to Cesium, an open-source JavaScript library for 3D data display: https://cesiumjs.org
  • Developers can use the Cesium’s Entity API to visualize the flight paths in 3D.
  • Depending on the desires of the studio those can be posted in aggregate updated in real time and navigable through an embedded Cesium 3D navigator.
  • Select signatures with pre-zoomed in perspectives are also possible.
  • Screenshots may also be the easiest/fastest way to curate the signatures.
  • Objective: creating a new online GUI that allows people to upload a KML file and outputs interactive trajectory through Cesium JS API

Hi Everyone, Hi @Joaquin

I have just downloaded data from a double Aerocene flight at Royal Holloway University last Wednesday.

The trajectory was not as spectacular as in the images pasted above in this thread from Aerocene flights in Salinas, but I would still like to work with the data further and I am particularly interested in overlaying the track on an image to produce a hybrid visual story / signature in the air. I was also thinking about combining the track from the aerocene flight we did last year with the one we did last week (both on the same field!) to create a historical record of signatures in the air at Royal Holloway.

What I have so far is the KML file in Google Earth. Any advice on translating this into an image, and combining two tracks from different moments in time, is much appreciated!

1 Like

Hi @sasha! Amazing flight! The images and aeroglyphs look beautiful.

In order to combine two Aeroglyphs you simply have to find each KML file and open each of them succesively with Google Earth, they should show up on the same visualization.

One common problem with Aeroglyphs visualization is a wide error margin on the Y axis offset.
GPS devices already have less resolution on the Y axis because of the properties of satellite trilateration. On top of this, the Google Earth terrain model has an important error margin on the same axis. In summary, this results on often parts of the Aeroglyph being hidden underneath earth on Google Earth’s 3D view, which can be observed on your visualization above.

This can be corrected with a very little, very simple code manipulation, that results in an updated KML file that includes an altitude offset property. In my experience, altering this offset results in much more realistic and better looking Aeroglyphs! The best tool to deal with this code is Sublime code editor.

On the following image you can see our recent flight from Miami, overimposed the same flight with a little altitude difference

This is how a neat KML file looks like. Actually I’ve thought of naming this KML filetype variant as Skyhole Mark Up language, instead of the original Keyhole Markup language. The code is commented to make it super clear to understand what changes what. The flight altitude offset canb be identified as “gx:altitudeOffset”


I am attaching on this post two files that are already commented and editable. In order to make your current flight look like these you might want to try to copy and replace all code between the coordinates
tags.
21 29

Albedo Miami Aeroglyph.kml (218.9 KB)

RHUL AEROCENE 0702 OK.kml (63.7 KB)

1 Like